Filter By
599 Repositories
Python
Multi-class confusion matrix library in Python
Table of contents Overview Installation Usage Document Try PyCM in Your Browser Issues & Bug Reports Todo Outputs Dependencies Contribution References
 1.3k Dec 31, 2022

Analytical Web Apps for Python, R, Julia, and Jupyter. No JavaScript Required.
Dash Dash is the most downloaded, trusted Python framework for building ML & data science web apps. Built on top of Plotly.js, React and Flask, Dash t
 17.9k Dec 31, 2022
CONTRIBUTIONS ONLY: Voluptuous, despite the name, is a Python data validation library.
CONTRIBUTIONS ONLY What does this mean? I do not have time to fix issues myself. The only way fixes or new features will be added is by people submitt
 1.8k Dec 31, 2022

Scientific Visualization: Python + Matplotlib
An open access book on scientific visualization using python and matplotlib
 8.6k Dec 31, 2022
A set of useful perceptually uniform colormaps for plotting scientific data
Colorcet: Collection of perceptually uniform colormaps Build Status Coverage Latest dev release Latest release Docs What is it? Colorcet is a collecti
 590 Dec 31, 2022
Area-weighted venn-diagrams for Python/matplotlib
Venn diagram plotting routines for Python/Matplotlib Routines for plotting area-weighted two- and three-circle venn diagrams. Installation The simples
 400 Dec 31, 2022

Easily configurable, chart dashboards from any arbitrary API endpoint. JSON config only
Flask JSONDash Easily configurable, chart dashboards from any arbitrary API endpoint. JSON config only. Ready to go. This project is a flask blueprint
 3.3k Dec 31, 2022
Open-questions - Open questions for Bellingcat technical contributors
Open questions for Bellingcat technical contributors These are difficult, long-term projects that would contribute to open source investigations at Be
 234 Dec 31, 2022

哔咔漫画window客户端,界面使用PySide2,已实现分类、搜索、收藏夹、下载、在线观看、waifu2x等功能。
picacomic-windows 哔咔漫画window客户端,界面使用PySide2,已实现分类、搜索、收藏夹、下载、在线观看等功能。 功能介绍 登陆分流,还原安卓端的三个分流入口 分类,搜索,排行,收藏夹使用同一的逻辑,滚轮下滑自动加载下一页,双击打开 漫画详情,章节列表和评论列表 下载功能,目
 1.8k Dec 31, 2022

I've demonstrated the working of the decision tree-based ID3 algorithm. Use an appropriate data set for building the decision tree and apply this knowledge to classify a new sample. All the steps have been explained in detail with graphics for better understanding.
Python Decision Tree and Random Forest Decision Tree A Decision Tree is one of the popular and powerful machine learning algorithms that I have learne
 185 Dec 31, 2022
:art: Diagram as Code for prototyping cloud system architectures
Diagrams Diagram as Code. Diagrams lets you draw the cloud system architecture in Python code. It was born for prototyping a new system architecture d
 27.5k Dec 30, 2022
Statistical data visualization using matplotlib
seaborn: statistical data visualization Seaborn is a Python visualization library based on matplotlib. It provides a high-level interface for drawing
 10.2k Dec 30, 2022

A little word cloud generator in Python
Linux macOS Windows PyPI word_cloud A little word cloud generator in Python. Read more about it on the blog post or the website. The code is tested ag
 9.2k Dec 30, 2022

Plotting library for IPython/Jupyter notebooks
bqplot 2-D plotting library for Project Jupyter Introduction bqplot is a 2-D visualization system for Jupyter, based on the constructs of the Grammar
 3.4k Dec 30, 2022

Productivity Tools for Plotly + Pandas
Cufflinks This library binds the power of plotly with the flexibility of pandas for easy plotting. This library is available on https://github.com/san
 2.7k Dec 30, 2022
Flipper Zero documentation repo
Flipper Zero Docs Participation To fix a bug or add something new to this repository, you need to open a pull-request. Also, on every page of the site
 114 Dec 30, 2022
Manim is an animation engine for explanatory math videos.
A community-maintained Python framework for creating mathematical animations.
 12.4k Dec 30, 2022

Plot, scatter plots and histograms in the terminal using braille dots
Plot, scatter plots and histograms in the terminal using braille dots, with (almost) no dependancies. Plot with color or make complex figures - similar to a very small sibling to matplotlib. Or use t
 207 Dec 30, 2022
A data visualization curriculum of interactive notebooks.
A data visualization curriculum of interactive notebooks, using Vega-Lite and Altair. This repository contains a series of Python-based Jupyter notebooks.
 1.2k Dec 30, 2022
Some useful extensions for Matplotlib.
mplx Some useful extensions for Matplotlib. Contour plots for functions with discontinuities plt.contour mplx.contour(max_jump=1.0) Matplotlib has pro
 519 Dec 30, 2022
termplotlib is a Python library for all your terminal plotting needs.
termplotlib termplotlib is a Python library for all your terminal plotting needs. It aims to work like matplotlib. Line plots For line plots, termplot
553 Dec 30, 2022
A tool for creating SVG timelines from simple JSON input.
A tool for creating SVG timelines from simple JSON input.
 432 Dec 30, 2022
🐞 📊 Ladybug extension to generate 2D charts
ladybug-charts Ladybug extension to generate 2D charts. Installation pip install ladybug-charts QuickStart import ladybug_charts API Documentation Loc
 3 Dec 30, 2022
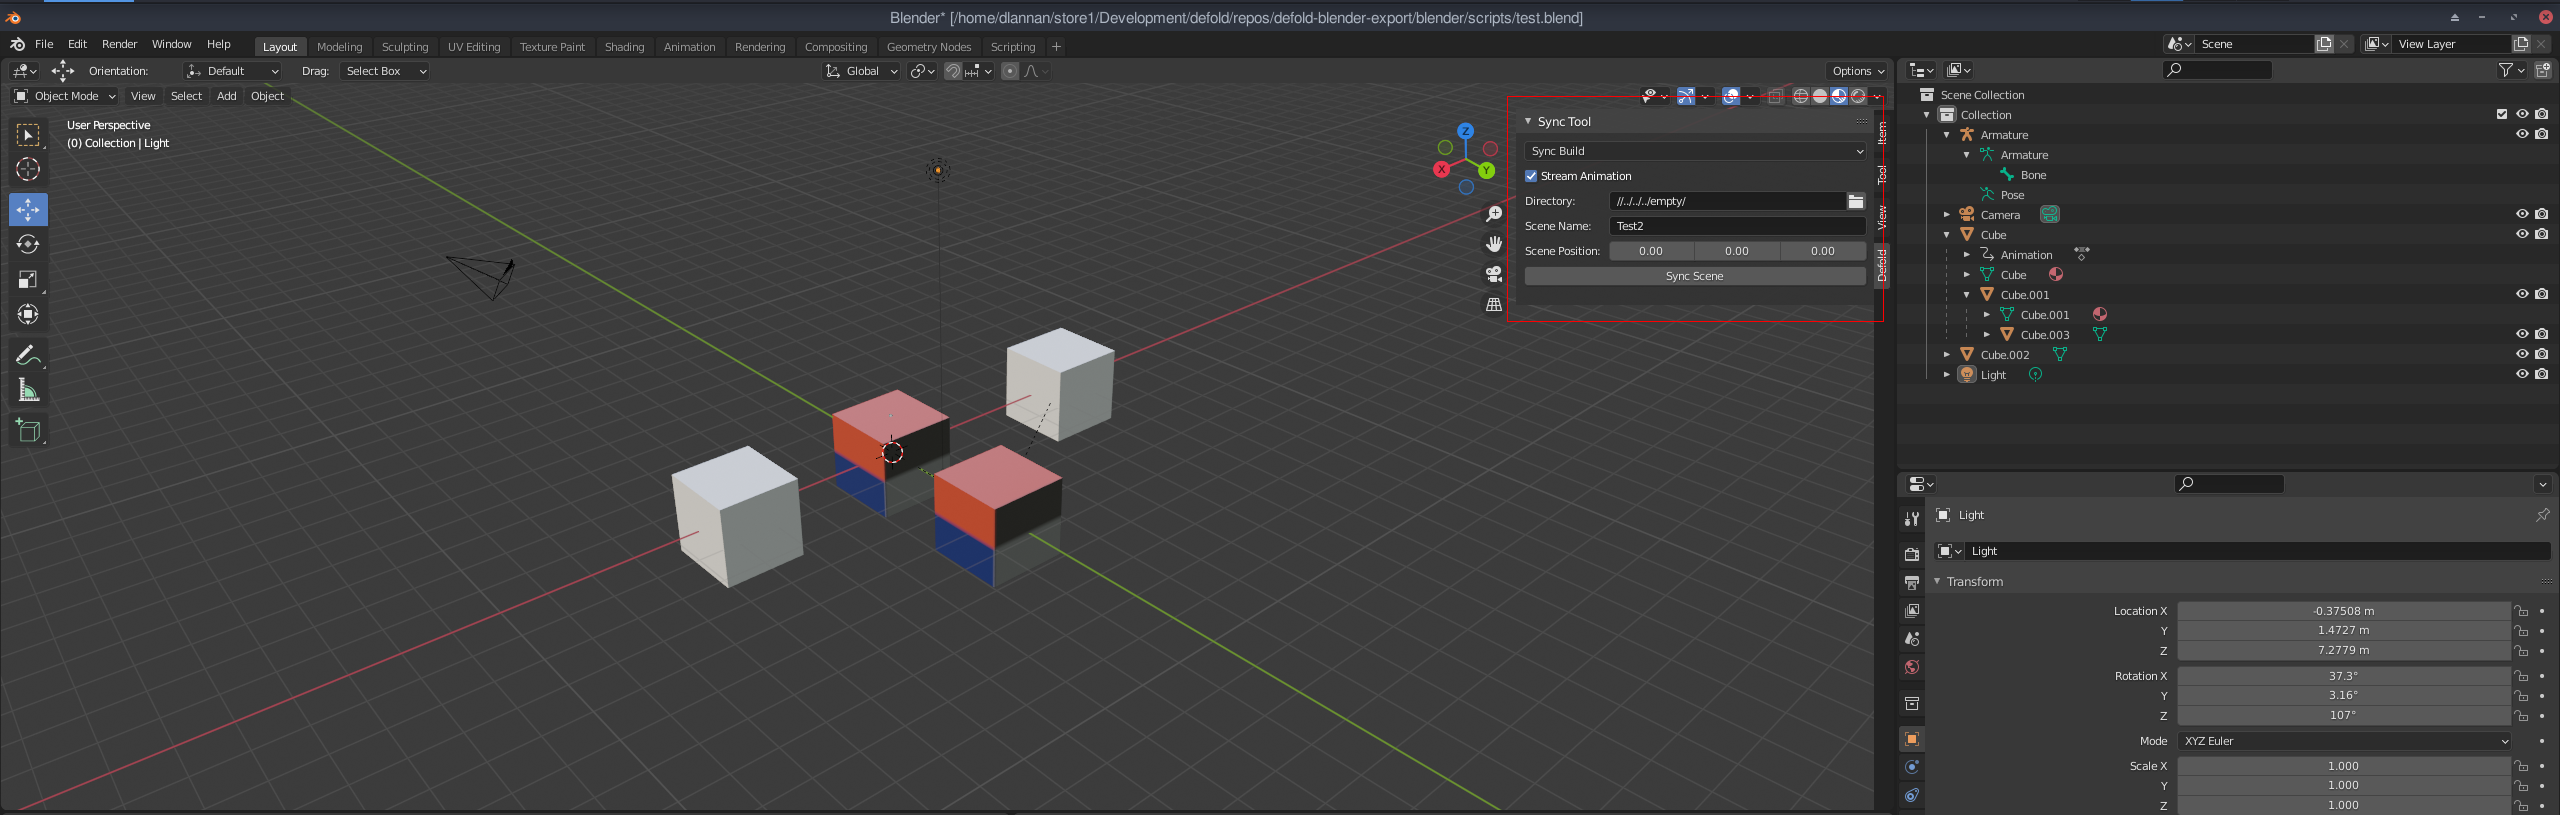
A blender import/export system for Defold
defold-blender-export A Blender export system for the Defold game engine. Setup Notes There are no exhaustive documents for this tool yet. Its just no
 27 Dec 30, 2022

Visualization of hidden layer activations of small multilayer perceptrons (MLPs)
MLP Hidden Layer Activation Visualization To gain some intuition about the internal representation of simple multi-layer perceptrons (MLPs) I trained
 7 Dec 30, 2022
Pydrawer: The Python package for visualizing curves and linear transformations in a super simple way
pydrawer 📐 The Python package for visualizing curves and linear transformations in a super simple way. ✏️ Installation Install pydrawer package with
 56 Dec 30, 2022

Plotly Dash Command Line Tools - Easily create and deploy Plotly Dash projects from templates
🛠️ dash-tools - Create and Deploy Plotly Dash Apps from Command Line | | | | | Create a templated multi-page Plotly Dash app with CLI in less than 7
 50 Dec 30, 2022