1University of British Columbia, 2NVIDIA, 3Université de Montréal
@article{strokestrip,
	title = {StrokeStrip: Joint Parameterization and Fitting of Stroke Clusters},
	author = {Pagurek van Mossel, Dave and Liu, Chenxi and Vining, Nicholas and Bessmeltsev, Mikhail and Sheffer, Alla},
	year = 2021,
	journal = {ACM Transactions on Graphics},
	publisher = {ACM},
	address = {New York, NY, USA},
	volume = 40,
	number = 4,
	doi = {10.1145/3450626.3459777}
}

StrokeStrip jointly parameterizes clusters of strokes (a) that, together, represent strips following a single intended curve (b). We compute the parameterization of this strip (c) restricted to the domain of the input strokes (d), which we then use to produce the parameterized intended curve (d).
./strokestrip input.scap [...args]Additional optional arguments:
--cut: If your input strokes include sharp back-and-forth turns, this flag will use the Cornucopia library to detect and cut such strokes.--debug: Generate extra SVG outputs to introspect the algorithm--rainbow: Generate an SVG showing parameterized strokes coloured with a rainbow gradient (default is red-to-blue)--widths: Generate fitted widths along with centerlines--taper: Force fitted widths to taper to 0 at endpoints
Drawings are inputted as .scap files, which encode strokes as polylines. Strokes are contained in pairs of braces { ... }. Each stroke has a unique stroke id and a cluster id shared by all strokes that colleectively make up one intended curve. Polyline samples can omit pressure by setting it to a default value of 0.
#[width]	[height]
@[thickness]
{
	#[stroke_id]	[cluster_id]
	[x1]	[y1]	[pressure1]
	[x2]	[y2]	[pressure2]
	[x3]	[y3]	[pressure3]
	[...etc]
}
[...etc]
Example .scap inputs are found in the examples/ directory.
Stroke clusters for new .scap files can be generated using the StrokeAggregator ground truth labeling program.
On a Mac, we supply a script to install dependencies, build the code, and generate the data for Figure 17 of the paper:
- Manually install Gurobi after obtaining a free academic license
- Run
./mac-install-and-run.sh - See the Recreating Figures section for a description of the output
Step-by-step instructions follow for non-fresh systems.
On a Mac, install XCode command line tools with:
xcode-select --installThe code has also been tested on Visual Studio Community on Windows.
On Mac, install Homebrew if not already installed:
/bin/bash -c "$(curl -fsSL https://raw.githubusercontent.com/Homebrew/install/HEAD/install.sh)"Then, install CMake:
brew install cmakeThis package relies on the Gurobi optimization library, which must be installed and licensed on your machine. If you are at a university, a free academic license can be obtained. This project was built with Gurobi 9.1; if you are using a newer version of Gurobi, update FindGUROBI.cmake to reference your installed version (e.g. change gurobi91 to gurobi92 for version 9.2.)
On a Mac, install Eigen via homebrew with:
brew install eigenFor other platforms, ensure that Eigen is installed and that its installation directory is included in $CMAKE_PREFIX_PATH.
StrokeStrip is configured with CMake:
mkdir build
cd build
cmake ..
makeOnce the code is built, to recreate the data in Fig. 17 of the paper, run:
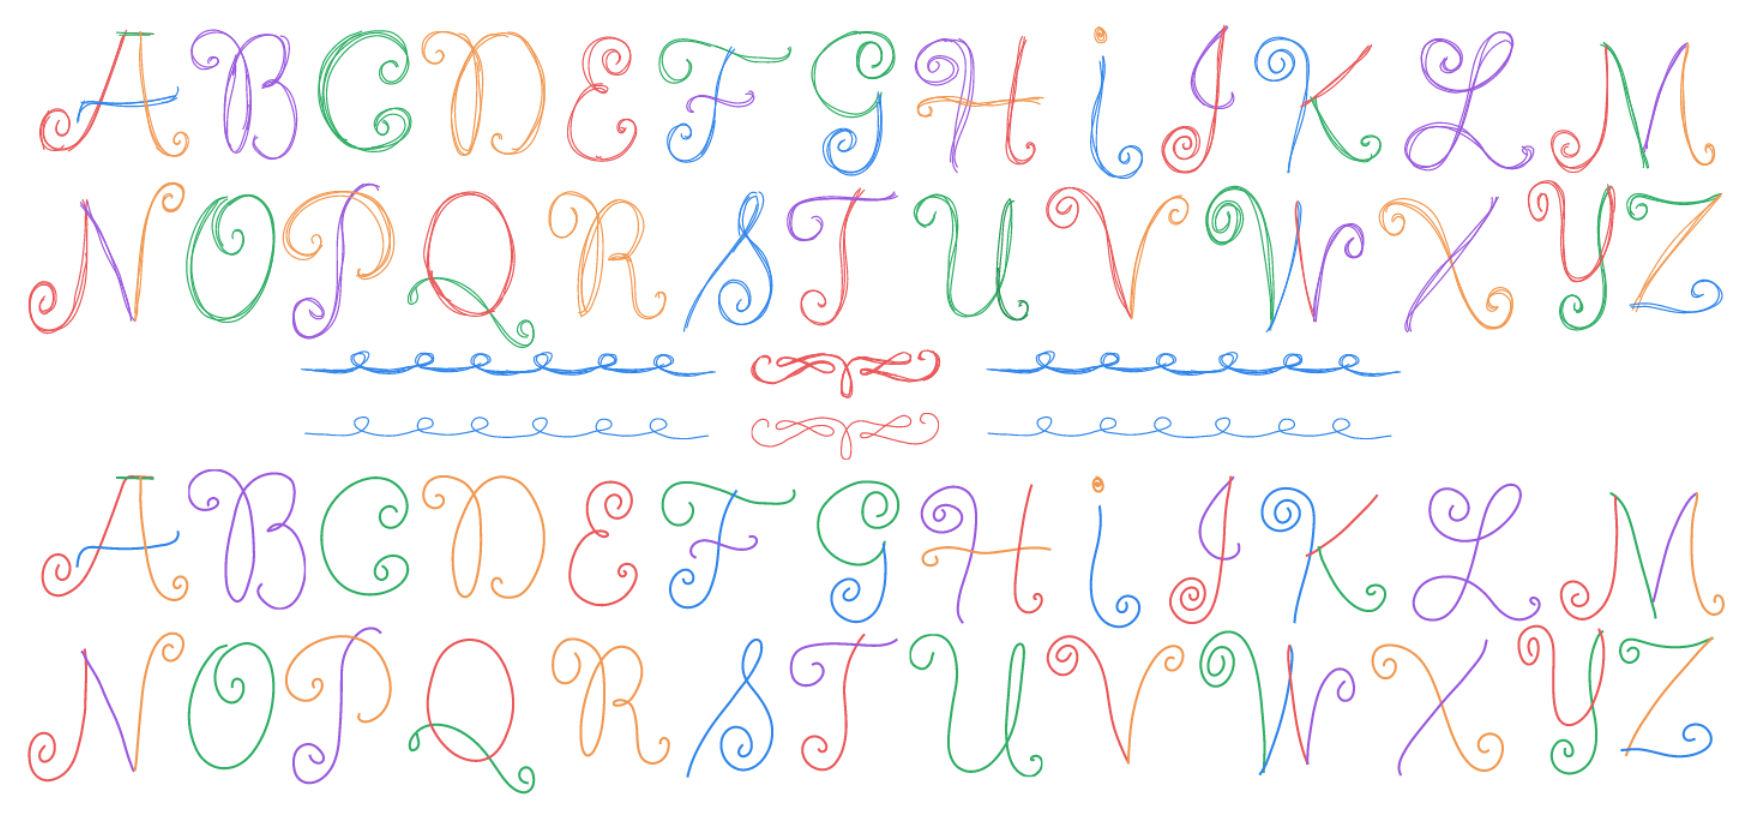
./examples/letters/generate_letters_data.shThis takes the .scap files in the examples/letters directory (encoding the clustered inputs in the top half of the figure in the format described in this README) and creates files ending with _fit.svg. These SVGs will contain the fitted curves from the bottom half of the figure, where each stroke represents one cluster from the input. The files ending in _param.svg contain the input strokes, coloured blue to red depending on the distance of each point on each stroke in the group (in the top of the figure, each stroke group is simply given a solid colour instead.)
The inputs for our user study are present in the examples/study_inputs directory. To generate our method's fitted curve for any example in the directory, run the following command, substituting the filename you wish to generate:
build/strokestrip examples/study_inputs/archi10c_SA_cluster.scap