This is a homework assignment for CSCI 40 class at Claremont McKenna College. Go to the project page to learn more!
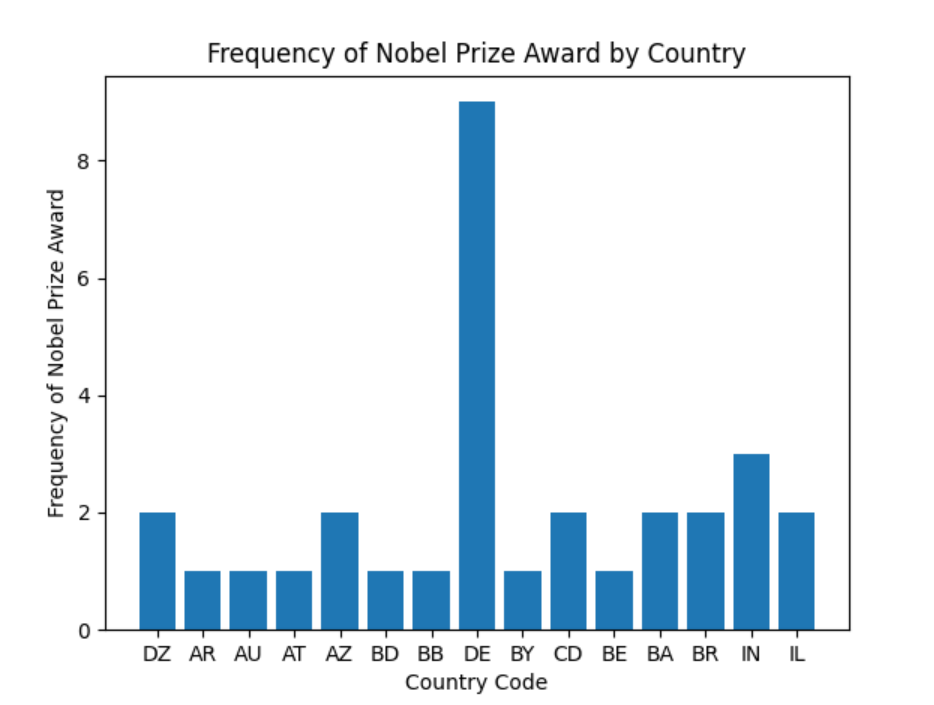
Graph 1 compares the frequency of Nobel Prizes awarded to different countries. Each country code represents a country. Among the 15 countries selected, Bavaria (DE) had nine individuals been awarded Nobel Prize. Check out other countries in this data set if you are interested!
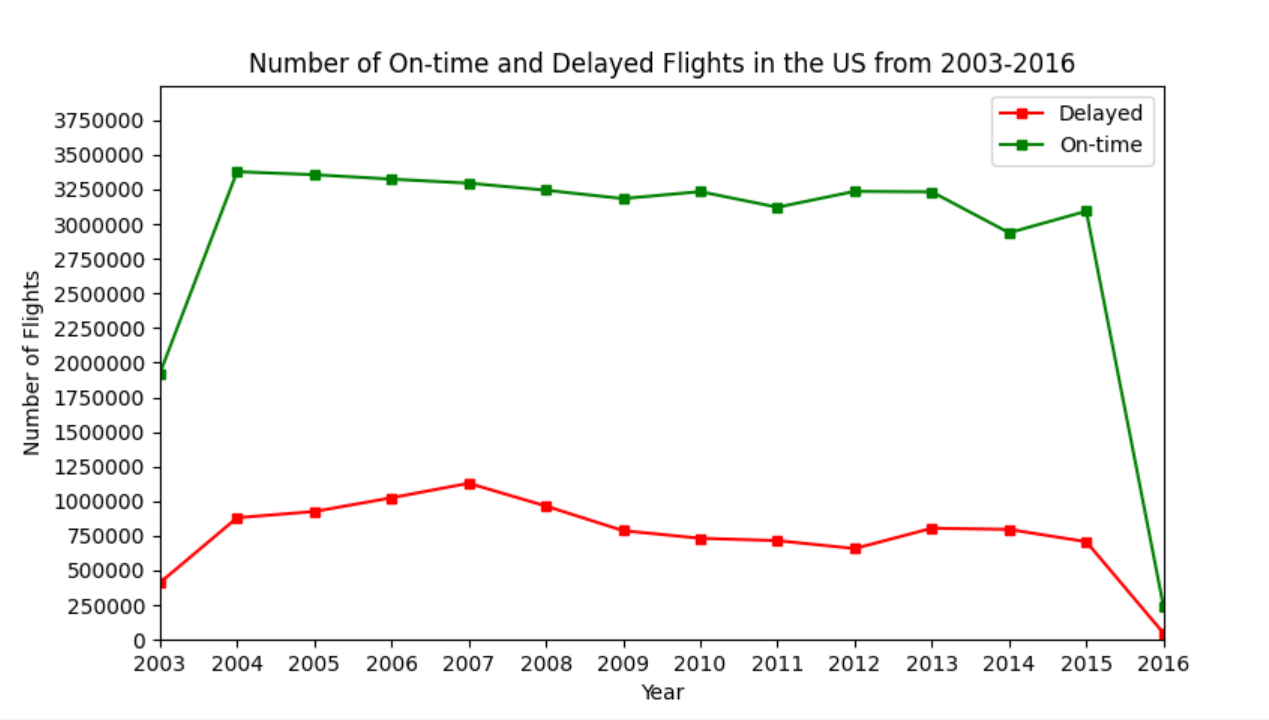
Graph 2 compares the number of on-time and delayed flights in the US from 2003 to 2016. The dataset used to create this graph included all major US airports. Based on this graph, we see that the difference between the number of on-time and delayed flights stayed consistent over the years, except for the year 2003 and 2016. If you are interested in about this, you can find the data set here!