Display machine state using Python3 with Flask.

Overview

Project Logo

Contributor Badge Gitter Badge NPM Badge License Badge Python Badge

Flask-State

English | 简体中文

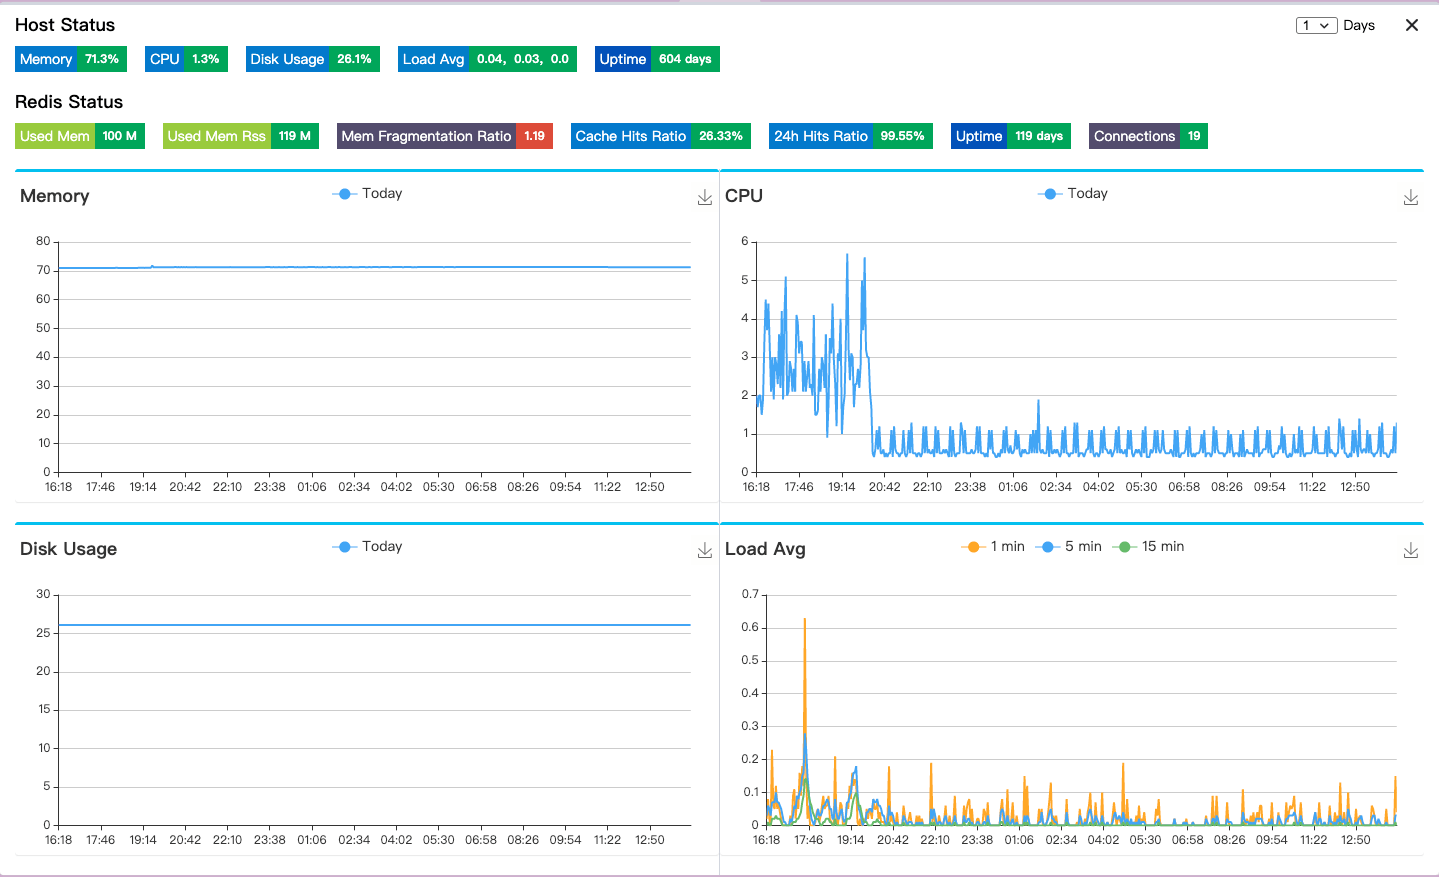
Flask-State is a lightweight chart plugin for displaying machine state data in your web application.

  • Monitored Metric: CPU, memory, disk usage, LoadAVG and boot time.
  • Extensible: Offers rich customization options, including redis monitoring, user authentication, custom logging, i18n and etc.
  • Stable: Solves multiprocessing concurrency problems (if you use gunicorn) built on top of lightweight dependencies.

This project is in active development and thoroughly tested to ensure that Flask-State stays up-to-date with its project roadmap.

Screenshot

Documentation

Check out the live demo, or head over to the tutorial for more instructions.

Installation

Get this plugin from PyPI:

pip install Flask-State

Alternatively, install Flask-State via NPM or include this script tag to the head section of your HTML document:

<script src="https://cdn.jsdelivr.net/gh/yoobool/[email protected]/packages/umd/flask-state.min.js"></script>
<link href="https://cdn.jsdelivr.net/gh/yoobool/[email protected]/packages/flask-state.min.css" rel="stylesheet">
npm install flask-state --save

Usage

1. Bind Database Address

from flask_state import DEFAULT_BIND_SQLITE
app.config['SQLALCHEMY_BINDS'] = {DEFAULT_BIND_SQLITE: 'sqlite:///path'}

2. Configure Flask-State

import flask_state
flask_state.init_app(app)

3. Include Imports to Views

// requires echarts module
import 'echarts';
import 'flask-state/flask-state.min.css';
import {init} from 'flask-state';
// Create a DOM node with ID 'test'. After init() binds the node,
// click to open the listening window
init({dom:document.getElementById('test')});

Learn more about advanced configurations in the documentation.

Contributing

See the planning document for a roadmap and existing feature requests.

Flask-State follows the Contributor Covenant Code of Conduct.

Alternatives

Looking for something else? Try another monitor project:

Community Channel

We're on Gitter! Join the conversation for more questions and inquiries about this project.

License

Flask-State is available under the BSD-3-Clause License.

Comments
  • Consider using dataclasses

    Consider using dataclasses

    I see that you're using sqlalchemy and db.Model to describe your data and queries.

    I've been trying to use dataclasses + fquery to do something similar.

    dataclasses-sql on sqlalchemy: most recent commits in the repo below have examples.

    https://github.com/adsharma/dataclasses-sql/tree/decorator

    More on fquery:

    https://adsharma.github.io/fquery/ https://github.com/adsharma/fquery

    Looking for django/flask projects to test these ideas out.

    opened by adsharma 4
  • i18n: improves Japanese translation.

    i18n: improves Japanese translation.

    I noticed that there were some errors in the Japanese localization. This PR aims to improve the Japanese translation by using established terminology.

    opened by hentai-chan 3
  • GitHub Action to lint Python code

    GitHub Action to lint Python code

    Output: https://github.com/cclauss/flask-state/actions

    Run pytest .
    ImportError while loading conftest '/home/runner/work/flask-state/flask-state/tests/conftest.py'.
    tests/conftest.py:4: in <module>
        from src.flask_state import DEFAULT_BIND_SQLITE
    E   ModuleNotFoundError: No module named 'src'
    Error: Process completed with exit code 4.
    
    opened by cclauss 3
  • Docs: Improved style, grammar and formatting.

    Docs: Improved style, grammar and formatting.

    I tried to improve the English translation while staying true to the original document. I also changed the formatting a little so that this README file conforms to markdown rules and recommendations.

    docs 
    opened by hentai-chan 2
  • Example needs a separate README

    Example needs a separate README

    Currently, it is unclear how to use example/, because there's no information available.

    Looks like it needs its own guide:

    • How to install all the required dependencies?
    • How to run the project?
    • What should you expect?
    • How to simulate the high-load so I can test that the metrics work?
    docs 
    opened by sobolevn 2
  • `name` field is duplicated in both setup.py and setup.cfg

    `name` field is duplicated in both setup.py and setup.cfg

    1. https://github.com/yoobool/flask-state/blob/master/setup.cfg#L2
    2. https://github.com/yoobool/flask-state/blob/master/setup.py#L8

    In my opinion, there should be only a single place to define this data.

    opened by sobolevn 2
  • Change disk usage plot to a pie chart or a disk chart.

    Change disk usage plot to a pie chart or a disk chart.

    Is your feature request related to a problem? Please describe. Change disk usage plot to a pie chart or a disk chart.

    Describe the solution you'd like The disk usage plot can be changed to a pie chart which will have a better representation.

    enhancement good first issue 
    opened by ajinsunny 2
  • log.exception does not show the full stack trace of the problem

    log.exception does not show the full stack trace of the problem

    Describe the bug When I use log.exception, the Flask-State does not log trace as expected.
    It just show the error msg like use log.error

    To Reproduce Steps to reproduce the behavior:

    1. Run the examples/app.py without change the example Redis config
    2. Change the services/host_status in line 94 from log.warning(t) to log.exception(t)
    3. When trigger the record events, timeout error will be raised

    Expected behavior log.exception will print full stack trace of the error

    Actual behavior Simply log imeout connecting to server and with confuse code line like the following output:

    FLASK_APP = examples/app.py
    FLASK_ENV = development
    FLASK_DEBUG = 1
    
    flask-state/env/bin/python -m flask run
     * Serving Flask app "examples/app.py" (lazy loading)
     * Environment: development
     * Debug mode: on
     * Running on http://127.0.0.1:5000/ (Press CTRL+C to quit)
     * Restarting with stat
    2020-11-22 23:11:20,821 | INFO | manager:record_timer:83 - Acquired file lock successfully. process ID: 29123
     * Debugger is active!
     * Debugger PIN: 161-836-542
    127.0.0.1 - - [22/Nov/2020 23:11:41] "GET / HTTP/1.1" 200 -
    2020-11-22 23:12:01,012 | ERROR | __init__:exception:1413 - Timeout connecting to server
    2020-11-22 23:12:01,025 | INFO | host_status:create_host_status:52 - Insert status
    

    Additional context Commit ID is 11c2ea4b29c40b3fa10cb85b38986eeca0b93ce3

    bug 
    opened by FesonX 2
  • Activation of DeepSource

    Activation of DeepSource

    Hi 👋

    One of my Pull Requests around fixing Code Quality Issues with DeepSource was merged here: https://github.com/yoobool/flask-state/pull/33

    I'd just like to inform you that the issues fixed here were detected by running DeepSource analysis on the repo. If you like, you can activate analysis for your repository to detect such code quality issues/bug risks on the fly for every change made. You can also use the Autofix feature to fix them with one click.

    The .deepsource.toml file you merged will only take effect if you activate analysis for this repo.

    Here's what you can do if you wish to activate DeepSource to continuously analyze your repository:

    • Sign up on DeepSource and activate analysis for this repository.
    • Create .deepsource.toml configuration which you can use to configure your analysis settings (My PR already added that, but feel free to edit it anytime).
    • Track/Check analysis here.

    If you have any doubts or questions, you can check out the docs, or feel free to reach out :)

    opened by HarshCasper 1
  • Memory usage of the application or the code

    Memory usage of the application or the code

    Real time use of the memory in the code e.g. if you import NumPy then what's the state of the memory. If you create a variable then how much did the memory increase. Increase or change in memory usage as per every line that's present in the code would be really helpful for the programmers.

    opened by Prashantmdgl9 1
  • Network monitor on web dashboard

    Network monitor on web dashboard

    Is your feature request related to a problem? Please describe. No

    Describe the solution you'd like Would be nice to have a network monitor in the dashboard. Something that depicted network information such as packets in/out, data received/sent, etc.

    Describe alternatives you've considered No alternative, but I think it would make a good addition to the dashboard.

    Additional context Might I recommend looking into the Scapy python library. It is a packet manipulation library that allows you to implement packet sniffers and network monitors.

    enhancement 
    opened by skekre98 1
  • Using custom exception with app error handler

    Using custom exception with app error handler

    Flask mentions Implementing API Exceptions in docs, which MAY be better than what we used in current project.

    from flask import jsonify
    
    class InvalidUsage(Exception):
        status_code = 400
    
        def __init__(self, message, status_code=None, payload=None):
            Exception.__init__(self)
            self.message = message
            if status_code is not None:
                self.status_code = status_code
            self.payload = payload
    
        def to_dict(self):
            rv = dict(self.payload or ())
            rv['message'] = self.message
            return rv
    
    @app.errorhandler(InvalidUsage)
    def handle_invalid_usage(error):
        response = jsonify(error.to_dict())
        response.status_code = error.status_code
        return response
    
    @app.route('/foo')
    def get_foo():
        """**Just raise and don't need more try-catch code!**"""
        raise InvalidUsage('This view is gone', status_code=410)
    
    enhancement 
    opened by FesonX 0
  • Temperature, number of users etc as the features

    Temperature, number of users etc as the features

    I believe the temperature of the machine will be an interesting feature as the machines overheat when running deep learning models locally. Boot time, number of threads can be an interesting addition as well.

    opened by Prashantmdgl9 1
  • Consider GPU and maybe some analytics

    Consider GPU and maybe some analytics

    GPU stats can be included too

    Also temperature of CPU and other internal components and the relation between usage and temperature can be interesting stats to look at...

    Besides, if you give interesting stats and analytics to your users and work on this area, it can be amazing and it brings a great advantage to your program. It may worth to inspect machine state monitor desktop programs to discover features that would match your project.

    enhancement 
    opened by FarshadAmiri 1
  • Prometheus metrics compatibility

    Prometheus metrics compatibility

    This is more like a question, not actually a feature request.

    For me right now it is unclear if I can use this project together with Prometheus stack. It is the default solution right now for monitoring things.

    Looks like it should be possible to use it instead of your own frontend to see the metrics. Or are there any problems / unknowns?

    opened by sobolevn 1
Releases(v1.1.4)
  • v1.1.4(Jun 18, 2021)

  • v1.1.3(May 11, 2021)

    Improvements

    • [Refactor] [back-end] Extract file lock decorator

    Bug Fixes

    • [Fix] [back-end] Fix the alembic_version table update version failed

    • [Fix] [back-end] Block other databases from creating alembic_version table

    Source code(tar.gz)
    Source code(zip)
  • v1.1.2(Apr 22, 2021)

    Features

    • [Feature] [back-end] Add user login information collection

    • [Feature] [back-end] Add Network IO packet sending and receiving data collection

    • [Feature] [back-end] Add disk IO read and write count collection

    Bug Fixes

    • [Fix] [back-end] Fix the error of querying the latest database version
    Source code(tar.gz)
    Source code(zip)
  • v1.1.1(Mar 31, 2021)

    Features

    • [Feature] [front-end] Add Disk IO line chart

    Improvements

    • [Refactor] [back-end] IO data returns the latest 480

    • [Style] [front-end] Modify CPUs legend width

    Bug Fixes

    • [Fix] [back-end] Fix database migration exception when a single process starts
    Source code(tar.gz)
    Source code(zip)
  • v1.1.0(Mar 24, 2021)

    Features

    • [Feature] [back-end] Add cpu multi-core data collection

    Improvements

    • [Refactor] [back-end] Refactor the returned data structure to speed up the front-end rendering speed

    Bug Fixes

    • [Fix] [back-end] Fix network IO data will increase abnormally
    Source code(tar.gz)
    Source code(zip)
  • v1.0.8(Mar 3, 2021)

    Improvements

    • [Refactor] [back-end] Refactor code

    • [Refactor] [back-end] Explicit conversion log print error content as str

    • [Refactor] [back-end] Prohibit multiple threads writing to the database at the same time

    • [Refactor] [back-end] Compatible to obtain some computers lacking io information

    Bug Fixes

    • [Fix] [back-end] Fix SQL delete operation failed and did not release resources in time
    Source code(tar.gz)
    Source code(zip)
  • v1.0.7(Feb 17, 2021)

    Features

    • [Feature] [back-end] Add disk IO and network IO data collection

    • [Feature] [front-end] Network IO line chart instead of disk usage line chart

    Improvements

    • [Refactor] [back-end] Split part of the bloated code

    • [Styles] [back-end] The latest status data acquisition is changed from reading from the database to real-time reading

    • [Styles] [back-end] Add redis missing tips

    Source code(tar.gz)
    Source code(zip)
  • v1.0.6(Jan 11, 2021)

    Improvements

    • [Styles] Improve README #31

    • [Refactor] [back-end] Code-Refactor #33

    • [Styles] [back-end] Added docker-compose and HOWTO #30

    • [Refactor] [back-end] Improve example application #24

    • [Styles] [front-end] Added I18N #20, #34

    Bug Fixes

    • [Fix] [back-end] Fix abnormal collection task behavior during host sleep

    • [Fix] [back-end] Fix the problem that redis is blocked

    • [Fix] [back-end] Fix the exception log path is incorrect

    • [Fix] [front-end] Fix some text display exception #38

    Source code(tar.gz)
    Source code(zip)
  • v1.0.5(Nov 20, 2020)

    Improvements

    • [Refactor] [back-end] Refactor the code according to the PE8 specification #16

    • [Styles] [front-end] Added Spanish and Indonesian #15

    • [Actions] [back-end] Actions test each operating system and Python version 3.5-3.9

    Bug Fixes

    • [Fix] [front-end] Fix an exception thrown in the console when the return code is not 200

    • [Fix] [back-end] Fix logger TypeError for Python 3.8 API change #14

    Source code(tar.gz)
    Source code(zip)
  • v1.0.4(Nov 11, 2020)

    1.0.4

    Improvements

    • [Refactor] [front-end] Modify font specifications and terminology

    • [Test] [back-end] GitHub Action to lint Python code #9

    Bug Fixes

    • [Fix] [back-end] Fix redis ImportError

    • [Fix] [back-end] Fix the problem that the Test module cannot run normally

    Source code(tar.gz)
    Source code(zip)
  • v1.0.3(Nov 6, 2020)

  • v1.0.2(Nov 6, 2020)

    Improvements

    • [Refactor] [front-end] Modify display styles.

    Bug Fixes

    • [Fix] [front-end] fix display problem in low resolution.

    • [Fix] [back-end] fix Windows system db_path no access.

    • [Fix] [back-end] fix the problem that the thread cannot end normally when receiving the exit signal.

    Source code(tar.gz)
    Source code(zip)
  • v1.0.0(Oct 21, 2020)

    Features

    • [Feature] [front-end] add custom Dom node binding trigger event.

    • [Feature] [front-end] add i18n-zh display language.

    • [Feature] [back-end] add logger print instructions, and users can customize the logger object.

    • [Feature] [back-end] when the user loads the flask-login module, the flask-state can be verified at the same time.

    Improvements

    • [Refactor] normalization code.

    • [Refactor] [front-end] compressed view files ( JavaScript, CSS ).

    Bug Fixes

    • [Fix] [front-end] fix duplicate addition of flask-state elements.

    • [Fix] [front-end] fix duplicate binding of mobile phone user switching label event.

    • [Fix] [back-end] fix the problem that non application/json header can request data.

    Source code(tar.gz)
    Source code(zip)
  • v0.0.1(Aug 29, 2020)

Real-time metrics for nginx server

ngxtop - real-time metrics for nginx server (and others) ngxtop parses your nginx access log and outputs useful, top-like, metrics of your nginx serve

Binh Le 6.4k Dec 22, 2022
Prometheus exporter for Flask applications

Prometheus Flask exporter This library provides HTTP request metrics to export into Prometheus. It can also track method invocations using convenient

Viktor Adam 535 Dec 23, 2022
ASGI middleware to record and emit timing metrics (to something like statsd)

timing-asgi This is a timing middleware for ASGI, useful for automatic instrumentation of ASGI endpoints. This was developed at GRID for use with our

Steinn Eldjárn Sigurðarson 99 Nov 21, 2022
Linux/OSX/FreeBSD resource monitor

Index Documents Description Features Themes Support and funding Prerequisites (Read this if you are having issues!) Dependencies Screenshots Installat

9k Jan 08, 2023
🚴 Call stack profiler for Python. Shows you why your code is slow!

pyinstrument Pyinstrument is a Python profiler. A profiler is a tool to help you 'optimize' your code - make it faster. It sounds obvious, but to get

Joe Rickerby 5k Jan 01, 2023
Sentry is cross-platform application monitoring, with a focus on error reporting.

Users and logs provide clues. Sentry provides answers. What's Sentry? Sentry is a service that helps you monitor and fix crashes in realtime. The serv

Sentry 33k Jan 04, 2023
Exports osu! user stats to prometheus metrics for a specified set of users

osu! to prometheus exporter This tool exports osu! user statistics into prometheus metrics for a specified set of user ids. Just copy the config.json.

Peter Oettig 1 Feb 24, 2022
Development tool to measure, monitor and analyze the memory behavior of Python objects in a running Python application.

README for pympler Before installing Pympler, try it with your Python version: python setup.py try If any errors are reported, check whether your Pyt

996 Jan 01, 2023
Cobalt Strike random C2 Profile generator

Random C2 Profile Generator Cobalt Strike random C2 Profile generator Author: Joe Vest (@joevest) This project is designed to generate malleable c2 pr

Threat Express 482 Jan 08, 2023
ScoutAPM Python Agent. Supports Django, Flask, and many other frameworks.

Scout Python APM Agent Monitor the performance of Python Django apps, Flask apps, and Celery workers with Scout's Python APM Agent. Detailed performan

Scout APM 59 Nov 26, 2022
Output provisioning profiles in a diffable way

normalize-profile This tool reads Apple's provisioning profile files and produces reproducible output perfect for diffing. You can easily integrate th

Keith Smiley 8 Oct 18, 2022
Prometheus instrumentation library for Python applications

Prometheus Python Client The official Python 2 and 3 client for Prometheus. Three Step Demo One: Install the client: pip install prometheus-client Tw

Prometheus 3.2k Jan 07, 2023
Sampling profiler for Python programs

py-spy: Sampling profiler for Python programs py-spy is a sampling profiler for Python programs. It lets you visualize what your Python program is spe

Ben Frederickson 9.5k Jan 08, 2023
Watch your Docker registry project size, then monitor it with Grafana.

Watch your Docker registry project size, then monitor it with Grafana.

Nova Kwok 33 Apr 05, 2022
Monitor Memory usage of Python code

Memory Profiler This is a python module for monitoring memory consumption of a process as well as line-by-line analysis of memory consumption for pyth

Fabian Pedregosa 80 Nov 18, 2022
System monitor - A python-based real-time system monitoring tool

System monitor A python-based real-time system monitoring tool Screenshots Installation Run My project with these commands pip install -r requiremen

Sachit Yadav 4 Feb 11, 2022
GoAccess is a real-time web log analyzer and interactive viewer that runs in a terminal in *nix systems or through your browser.

GoAccess What is it? GoAccess is an open source real-time web log analyzer and interactive viewer that runs in a terminal on *nix systems or through y

Gerardo O. 15.6k Jan 02, 2023
Automatically monitor the evolving performance of Flask/Python web services.

Flask Monitoring Dashboard A dashboard for automatic monitoring of Flask web-services. Key Features • How to use • Live Demo • Feedback • Documentatio

663 Dec 29, 2022
Middleware for Starlette that allows you to store and access the context data of a request. Can be used with logging so logs automatically use request headers such as x-request-id or x-correlation-id.

starlette context Middleware for Starlette that allows you to store and access the context data of a request. Can be used with logging so logs automat

Tomasz Wójcik 300 Dec 26, 2022