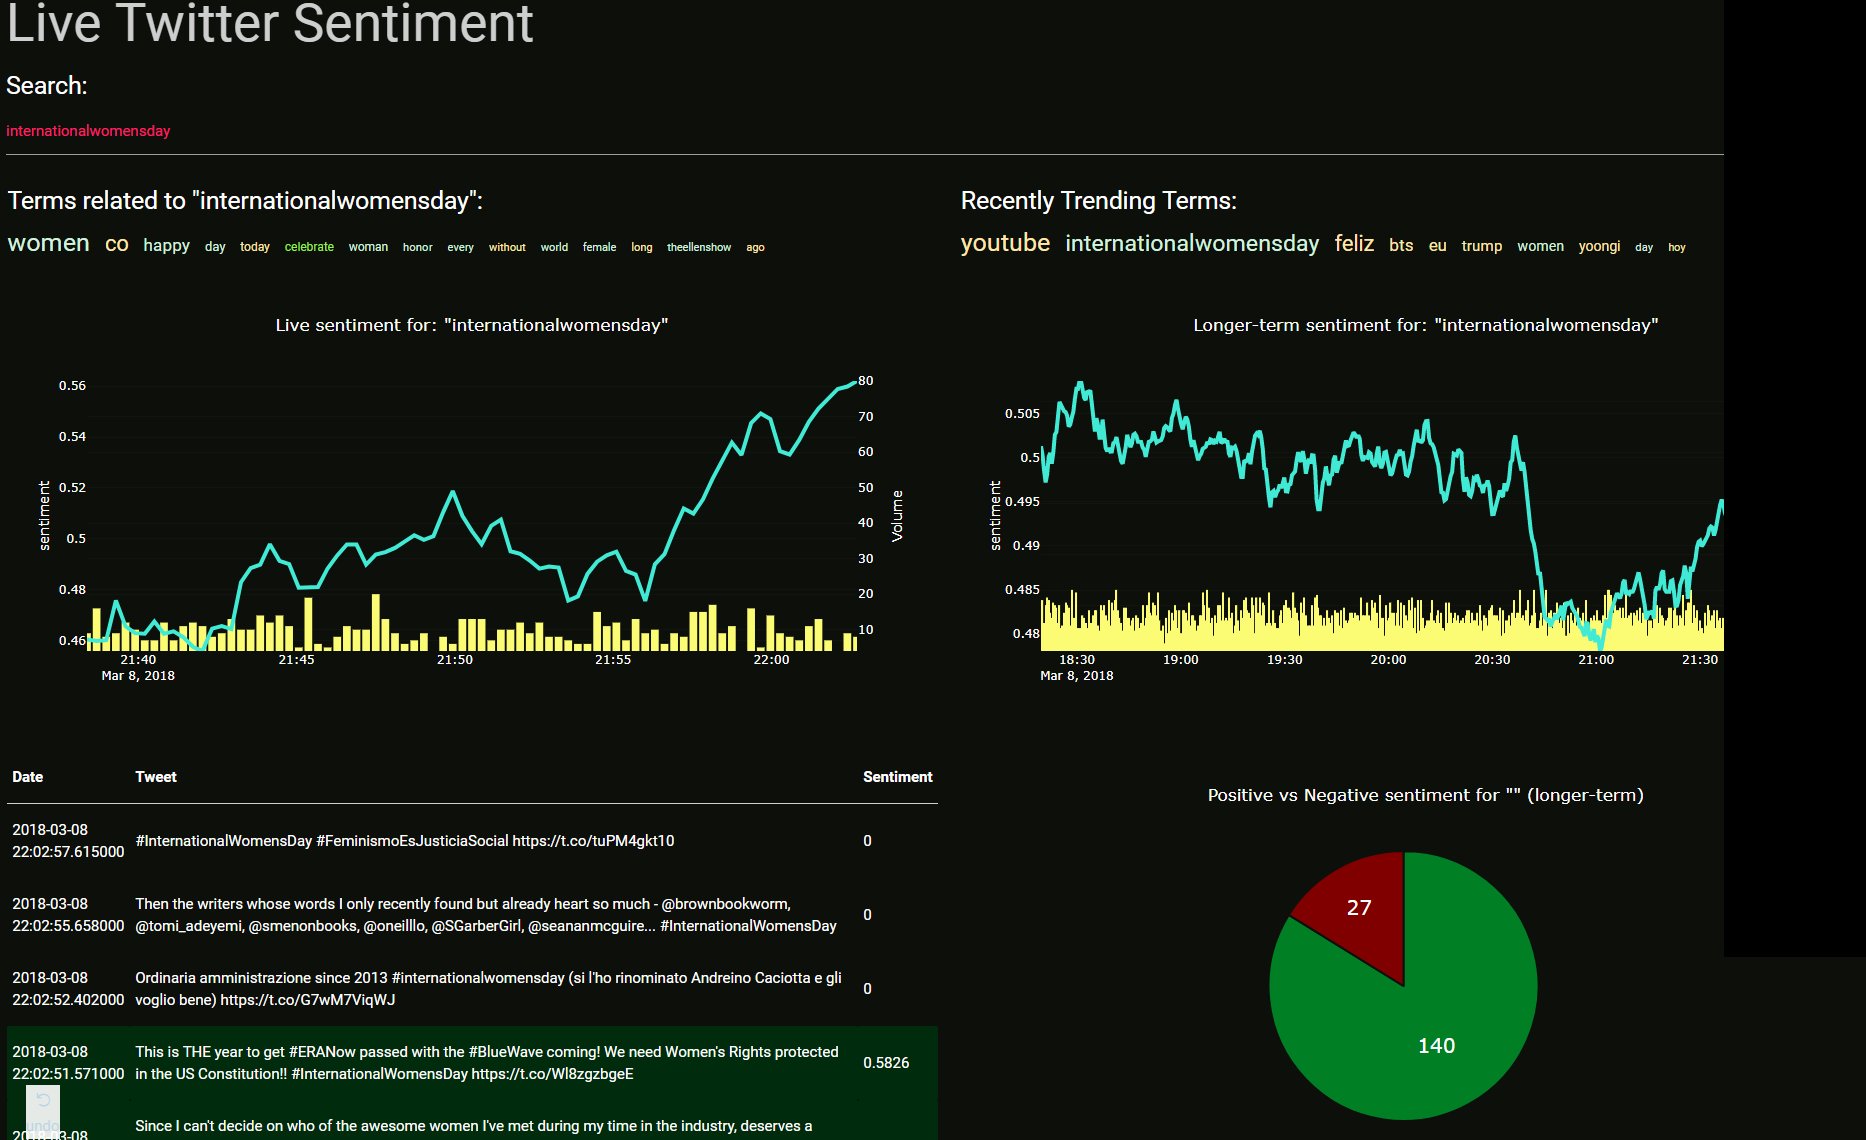
Sentiment Analysis application created with Python and Dash, hosted at socialsentiment.net

Overview

Social Sentiment Dash Application

Live-streaming sentiment analysis application created with Python and Dash, hosted at SocialSentiment.net.

application example

Dash Tutorials

This application was created in conjunction with the Dash tutorial series.

Repo Contents:

  • dash_mess.py - This is currently the main front-end application code. Contains the dash application layouts, logic for graphs, interfaces with the database...etc. Name is descriptive of the overall state of code :) ...this code is setup to run on a flask instance. If you want to clone this and run it locally, you will be using the dev_server.py
  • dev_server.py - If you wish to run this application locally, on the dev server, run via this instead.
  • twitter_stream.py - This should run in the background of your application. This is what streams tweets from Twitter, storing them into the sqlite database, which is what the dash_mess.py file interfaces with.
  • config.py - Meant for many configurations, but right now it just contains stop words. Words we don't intend to ever count in the "trending"
  • cache.py - For caching purposes in effort to get things to run faster.
  • db-truncate.py - A script to truncate the infinitely-growing sqlite database. You will get about 3.5 millionish tweets per day, depending on how fast you can process. You can keep these, but, as the database grows, search times will dramatically suffer.

Quick start

  • Clone repo
  • install requirements.txt using pip install -r requirements.txt
  • Fill in your Twitter App credentials to twitter_stream.py. Go to apps.twitter.com to set that up if you need to.
  • Run twitter_stream.py to build database
  • If you're using this locally, you can run the application with the dev_server.py script. If you want to deploy this to a webserver, see my deploying Dash application tutorial
  • You might need the latest version of sqlite.
sudo add-apt-repository ppa:jonathonf/backports
sudo apt-get update && sudo apt-get install sqlite3
  • Consider running the db-truncate.py from time to time (or via a cronjob), to keep the database reasonably sized. In its current state, the database really doesn't need to store more than 2-3 days of data most likely.

Tips for Running on Server

  • You can use Gunicorn to run the server
gunicorn dash_mess:server -b 0.0.0.0:80 -w 4

Todo

Want to help contribute???

  • Code is ugly. Low hanging fruit is just making the code not so ugly. Up to this point, I've just been in "make it work" mode.
  • App is ugly. I am not a designer. This app is prettttttyyyyyy gross. Think you have a better design? Halp.
  • Click-able related terms and trending terms would be nice. I tried, but failed at this. It'd be cool to see a related term, and be able to just click on it, and this becomes the new searched term, for example.
  • The interactive search is cool, but also does a search in the database per-character. It would be nice if it didn't search per key-press. Not sure I want a search button, I like the streamlined interactivity, but maybe wait 0.2 seconds or something without any new keypresses to perform the search? Something like that might help with speeds. I really do not know the best option here, I just know this isn't idea.
  • Other manipulations or ideas for interactivity? Feel free to show them in a PR.

Credits

The speed of the application, especially with a database with 10's of millions of records is thanks entirely to Daniel Kukiela who helped us to convert from regular sqlite to using fts, helping with the queries, new database structure, caching, and more.
Owner
Harrison
Harrison
D-Analyst : High Performance Visualization Tool

D-Analyst : High Performance Visualization Tool D-Analyst is a high performance data visualization built with python and based on OpenGL. It allows to

4 Apr 14, 2022
A simple python script using Numpy and Matplotlib library to plot a Mohr's Circle when given a two-dimensional state of stress.

Mohr's Circle Calculator This is a really small personal project done for Department of Civil Engineering, Delhi Technological University (formerly, D

Agyeya Mishra 0 Jul 17, 2021
clock_plot provides a simple way to visualize timeseries data, mapping 24 hours onto the 360 degrees of a polar plot

clock_plot clock_plot provides a simple way to visualize timeseries data mapping 24 hours onto the 360 degrees of a polar plot. For usage, please see

12 Aug 24, 2022
With Holoviews, your data visualizes itself.

HoloViews Stop plotting your data - annotate your data and let it visualize itself. HoloViews is an open-source Python library designed to make data a

HoloViz 2.3k Jan 04, 2023
Jupyter notebook and datasets from the pandas Q&A video series

Python pandas Q&A video series Read about the series, and view all of the videos on one page: Easier data analysis in Python with pandas. Jupyter Note

Kevin Markham 2k Jan 05, 2023
Generate SVG (dark/light) images visualizing (private/public) GitHub repo statistics for profile/website.

Generate daily updated visualizations of GitHub user and repository statistics from the GitHub API using GitHub Actions for any combination of private and public repositories, whether owned or contri

Adam Ross 2 Dec 16, 2022
100 data puzzles for pandas, ranging from short and simple to super tricky (60% complete)

100 pandas puzzles Puzzles notebook Solutions notebook Inspired by 100 Numpy exerises, here are 100* short puzzles for testing your knowledge of panda

Alex Riley 1.9k Jan 08, 2023
Voilà, install macOS on ANY Computer! This is really and magic easiest way!

OSX-PROXMOX - Run macOS on ANY Computer - AMD & Intel Install Proxmox VE v7.02 - Next, Next & Finish (NNF). Open Proxmox Web Console - Datacenter N

Gabriel Luchina 654 Jan 09, 2023
PyFlow is a general purpose visual scripting framework for python

PyFlow is a general purpose visual scripting framework for python. State Base structure of program implemented, such things as packages disco

1.8k Jan 07, 2023
A custom qq-plot for two sample data comparision

QQ-Plot 2 Sample Just a gist to include the custom code to draw a qq-plot in python when dealing with a "two sample problem". This means when u try to

1 Dec 20, 2021
A high-level plotting API for pandas, dask, xarray, and networkx built on HoloViews

hvPlot A high-level plotting API for the PyData ecosystem built on HoloViews. Build Status Coverage Latest dev release Latest release Docs What is it?

HoloViz 694 Jan 04, 2023
The official colors of the FAU as matplotlib/seaborn colormaps

FAU - Colors The official colors of Friedrich-Alexander-Universität Erlangen-Nürnberg (FAU) as matplotlib / seaborn colormaps. We support the old colo

Machine Learning and Data Analytics Lab FAU 9 Sep 05, 2022
Make your BSC transaction simple.

bsc_trade_history Make your BSC transaction simple. 中文ReadMe Background: inspired by debank ,Practice my hands on this small project Blog:Crypto-BscTr

foolisheddy 7 Jul 06, 2022
Scientific measurement library for instruments, experiments, and live-plotting

PyMeasure scientific package PyMeasure makes scientific measurements easy to set up and run. The package contains a repository of instrument classes a

PyMeasure 445 Jan 04, 2023
Fast visualization of radar_scenes based on oleschum/radar_scenes

RadarScenes Tools About This python package provides fast visualization for the RadarScenes dataset. The Open GL based visualizer is smoother than ole

Henrik Söderlund 2 Dec 09, 2021
I'm doing Genuary, an aritifiacilly generated month to build code that make beautiful things

Genuary 2022 I'm doing Genuary, an aritifiacilly generated month to build code that make beautiful things. Every day there is a new prompt for making

Joaquín Feltes 1 Jan 10, 2022
FairLens is an open source Python library for automatically discovering bias and measuring fairness in data

FairLens FairLens is an open source Python library for automatically discovering bias and measuring fairness in data. The package can be used to quick

Synthesized 69 Dec 15, 2022
A high-level plotting API for pandas, dask, xarray, and networkx built on HoloViews

hvPlot A high-level plotting API for the PyData ecosystem built on HoloViews. Build Status Coverage Latest dev release Latest release Docs What is it?

HoloViz 697 Jan 06, 2023
Apache Superset is a Data Visualization and Data Exploration Platform

Apache Superset is a Data Visualization and Data Exploration Platform

The Apache Software Foundation 49.9k Jan 02, 2023
Simple CLI python app to show a stocks graph performance. Made with Matplotlib and Tiingo.

stock-graph-python Simple CLI python app to show a stocks graph performance. Made with Matplotlib and Tiingo. Tiingo API Key You will need to add your

Toby 3 May 14, 2022