
Bayesian inference in HSMMs and HMMs
This is a Python library for approximate unsupervised inference in Bayesian Hidden Markov Models (HMMs) and explicit-duration Hidden semi-Markov Models (HSMMs), focusing on the Bayesian Nonparametric extensions, the HDP-HMM and HDP-HSMM, mostly with weak-limit approximations.
There are also some extensions:
Installing from PyPI
Give this a shot:
pip install pyhsmm
You may need to install a compiler with -std=c++11 support, like gcc-4.7 or higher.
To install manually from the git repo, you'll need cython. Then try this:
python setup.py install
It might also help to look at the travis file to see how to set up a working install from scratch.
Running
See the examples directory.
For the Python interpreter to be able to import pyhsmm, you'll need it on your Python path. Since the current working directory is usually included in the Python path, you can probably run the examples from the same directory in which you run the git clone with commands like python pyhsmm/examples/hsmm.py. You might also want to add pyhsmm to your global Python path (e.g. by copying it to your site-packages directory).
A Simple Demonstration
Here's how to draw from the HDP-HSMM posterior over HSMMs given a sequence of observations. (The same example, along with the code to generate the synthetic data loaded in this example, can be found in examples/basic.py.)
Let's say we have some 2D data in a data.txt file:
$ head -5 data.txt
-3.711962552600095444e-02 1.456401745267922598e-01
7.553818775915704942e-02 2.457422192223903679e-01
-2.465977987699214502e+00 5.537627981813508793e-01
-7.031638516485749779e-01 1.536468304146855757e-01
-9.224669847039665971e-01 3.680035337673161489e-01
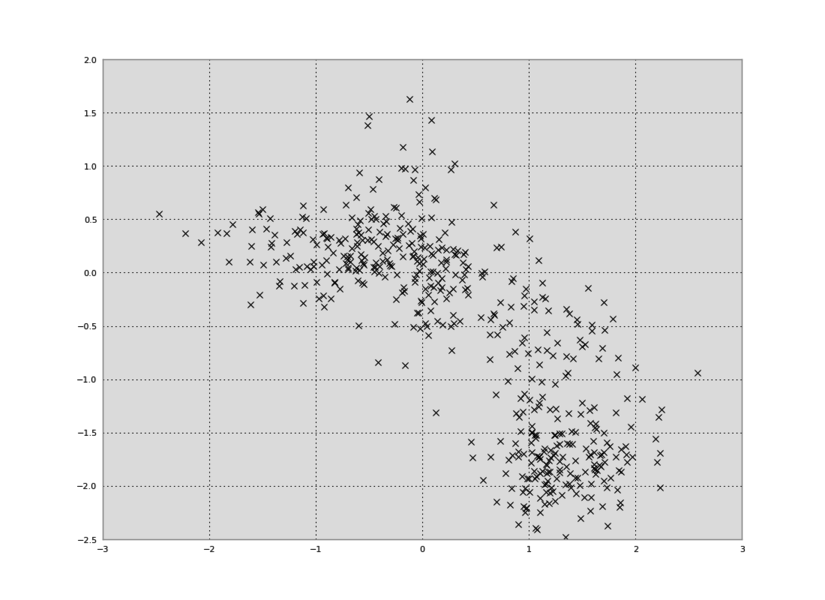
In Python, we can plot the data in a 2D plot, collapsing out the time dimension:
import numpy as np
from matplotlib import pyplot as plt

data = np.loadtxt('data.txt')
plt.plot(data[:,0],data[:,1],'kx')
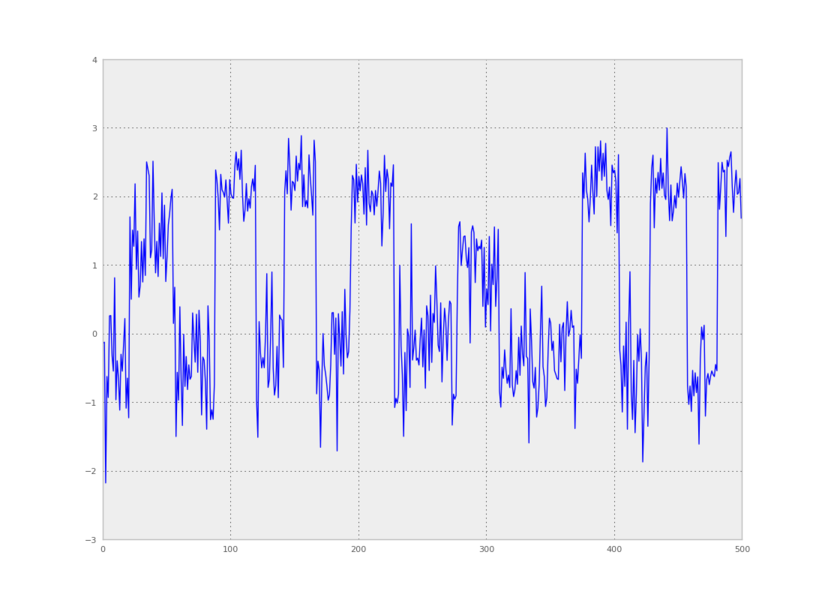
We can also make a plot of time versus the first principal component:
from pyhsmm.util.plot import pca_project_data
plt.plot(pca_project_data(data,1))
To learn an HSMM, we'll use pyhsmm to create a WeakLimitHDPHSMM instance using some reasonable hyperparameters. We'll ask this model to infer the number of states as well, so we'll give it an Nmax parameter:
import pyhsmm
import pyhsmm.basic.distributions as distributions

obs_dim = 2
Nmax = 25

obs_hypparams = {'mu_0':np.zeros(obs_dim),
                'sigma_0':np.eye(obs_dim),
                'kappa_0':0.3,
                'nu_0':obs_dim+5}
dur_hypparams = {'alpha_0':2*30,
                 'beta_0':2}

obs_distns = [distributions.Gaussian(**obs_hypparams) for state in range(Nmax)]
dur_distns = [distributions.PoissonDuration(**dur_hypparams) for state in range(Nmax)]

posteriormodel = pyhsmm.models.WeakLimitHDPHSMM(
        alpha=6.,gamma=6., # better to sample over these; see concentration-resampling.py
        init_state_concentration=6., # pretty inconsequential
        obs_distns=obs_distns,
        dur_distns=dur_distns)
(The first two arguments set the "new-table" proportionality constant for the meta-Chinese Restaurant Process and the other CRPs, respectively, in the HDP prior on transition matrices. For this example, they really don't matter at all, but on real data it's much better to infer these parameters, as in examples/concentration_resampling.py.)
Then, we add the data we want to condition on:
posteriormodel.add_data(data,trunc=60)
The trunc parameter is an optional argument that can speed up inference: it sets a truncation limit on the maximum duration for any state. If you don't pass in the trunc argument, no truncation is used and all possible state duration lengths are considered. (pyhsmm has fancier ways to speed up message passing over durations, but they aren't documented.)
If we had multiple observation sequences to learn from, we could add them to the model just by calling add_data() for each observation sequence.
Now we run a resampling loop. For each iteration of the loop, all the latent variables of the model will be resampled by Gibbs sampling steps, including the transition matrix, the observation means and covariances, the duration parameters, and the hidden state sequence. We'll also copy some samples so that we can plot them.
models = []
for idx in progprint_xrange(150):
    posteriormodel.resample_model()
    if (idx+1) % 10 == 0:
        models.append(copy.deepcopy(posteriormodel))
Now we can plot our saved samples:
fig = plt.figure()
for idx, model in enumerate(models):
    plt.clf()
    model.plot()
    plt.gcf().suptitle('HDP-HSMM sampled after %d iterations' % (10*(idx+1)))
    plt.savefig('iter_%.3d.png' % (10*(idx+1)))
I generated these data from an HSMM that looked like this:
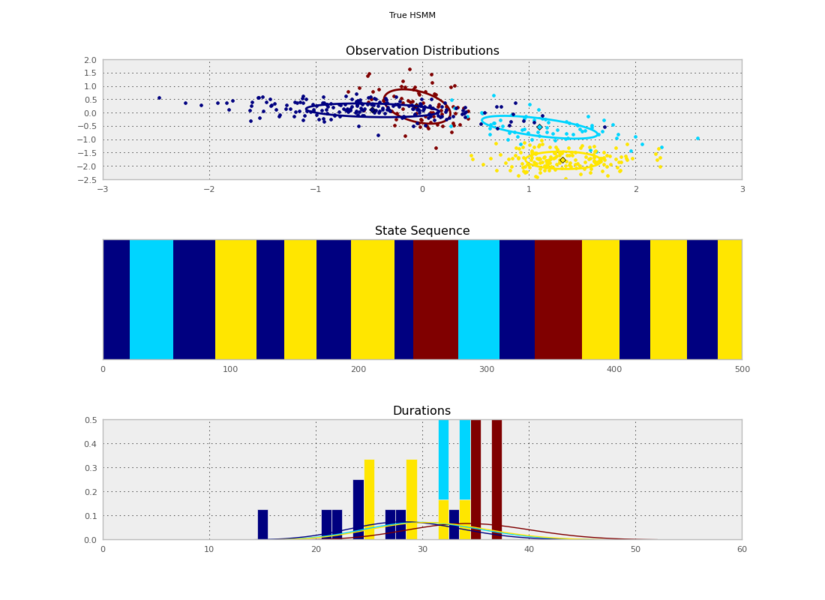
So the posterior samples look pretty good!
A convenient shortcut to build a list of sampled models is to write
model_samples = [model.resample_and_copy() for itr in progprint_xrange(150)]
That will build a list of model objects (each of which can be inspected, plotted, pickled, etc, independently) in a way that won't duplicate data that isn't changed (like the observations or hyperparameter arrays) so that memory usage is minimized. It also minimizes file size if you save samples like
import cPickle
with open('sampled_models.pickle','w') as outfile:
    cPickle.dump(model_samples,outfile,protocol=-1)
Extending the Code
To add your own observation or duration distributions, implement the interfaces defined in basic/abstractions.py. To get a flavor of the style, see pybasicbayes.
References
-
Matthew J. Johnson. Bayesian Time Series Models and Scalable Inference. MIT PhD Thesis, May 2014.
-
Matthew J. Johnson and Alan S. Willsky. Bayesian Nonparametric Hidden Semi-Markov Models. Journal of Machine Learning Research (JMLR), 14:673–701, February 2013.
-
Matthew J. Johnson and Alan S. Willsky, The Hierarchical Dirichlet Process Hidden Semi-Markov Model. 26th Conference on Uncertainty in Artificial Intelligence (UAI 2010), Avalon, California, July 2010.
@article{johnson2013hdphsmm,
    title={Bayesian Nonparametric Hidden Semi-Markov Models},
    author={Johnson, Matthew J. and Willsky, Alan S.},
    journal={Journal of Machine Learning Research},
    pages={673--701},
    volume={14},
    month={February},
    year={2013},
}
Authors
Matt Johnson, Alex Wiltschko, Yarden Katz, Chia-ying (Jackie) Lee, Scott Linderman, Kevin Squire, Nick Foti.

 2 Jan 06, 2022
 58 Dec 11, 2022
 1 Jan 24, 2022
 2.9k Jan 08, 2023
 180 Dec 18, 2022
 1 Dec 09, 2021
 5 Dec 01, 2022
 2.2k Dec 28, 2022
 1 Feb 07, 2022
 44 Oct 14, 2022
 264 Dec 30, 2022
 1 Jan 24, 2022
 229 Dec 29, 2022
 93 Jan 03, 2023
 758 Dec 30, 2022
 1 Nov 24, 2021
 210 Jan 02, 2023
 8 Feb 15, 2022
 107 Jan 04, 2023
 14 Nov 21, 2022