Collection of data visualizing projects through Tableau, Data Wrapper, and Power BI

Overview

Data-Visualization-Projects

Collection of data visualizing projects through Tableau, Data Wrapper, and Power BI

Indigenous-Brands-Social-Movements

Python(Pandas, NumPy, Re, Matplotlib), Data Visualization(Data Wrapper)

Selected as a part of competitive UC Berkeley Data Discovery Research Programs, "Indigenous Brands & Social Movements"

  • Cleaned datasets of trademarks owned by Native American Tribes through eliminating unnecessary columns, filling NAs with 0 other values
  • Based on the cleaned datasets, visualized locations of the trademarks on maps through usage of data visualization tool called DataWrapper

Research Program Description

Have you noticed how many brands in the marketplace use indigenous/Native American - oriented terms and imagery? From the notorious Washington Team to the logo on Land of Lakes butter, indigenous imagery and appropriation is everywhere, and worthy of serious study and data analysis. This project aims to bring the work of social movements and activism to a data-intensive study of First Nations brands and trademarks in order to chart a path forward. In this project, we will study how many of these terms are owned by native vs. non-native entities, study how these brands have changed over time, and how the law might be better deployed to protect ownership of indigenously oriented trademarks, and encourage retiring marks that are considered offensive or appropriative.

  • University of California, Berkeley / Data Discovery Research Program Project

Visualization of Homeless in the States using Tableau

Screen Shot 2021-08-18 at 9 07 04 PM

  • Dataset of statistics of homeless from Kaggle and Github

  • This dashboard answers the followings:

    • Which state has the most number of homeless?
    • Is there a difference of the number of homeless between 2012 and 2013?
    • In what state and how many of homeless people of each type(Unsheltered, families, veterans, unaccompanied children, and chronic) are there?
  • This dashboard is composed of the followings:

    • Bubbles of the number of homeless by the States
    • Map of the United States by the number of homeless
    • Stacked bar of the number of homeless for each type with selected State
    • Side-by-Side bar chart of the number of homeless in 2012 and 2013
  • Individual Project by Jinwoo(Roy) Yoon

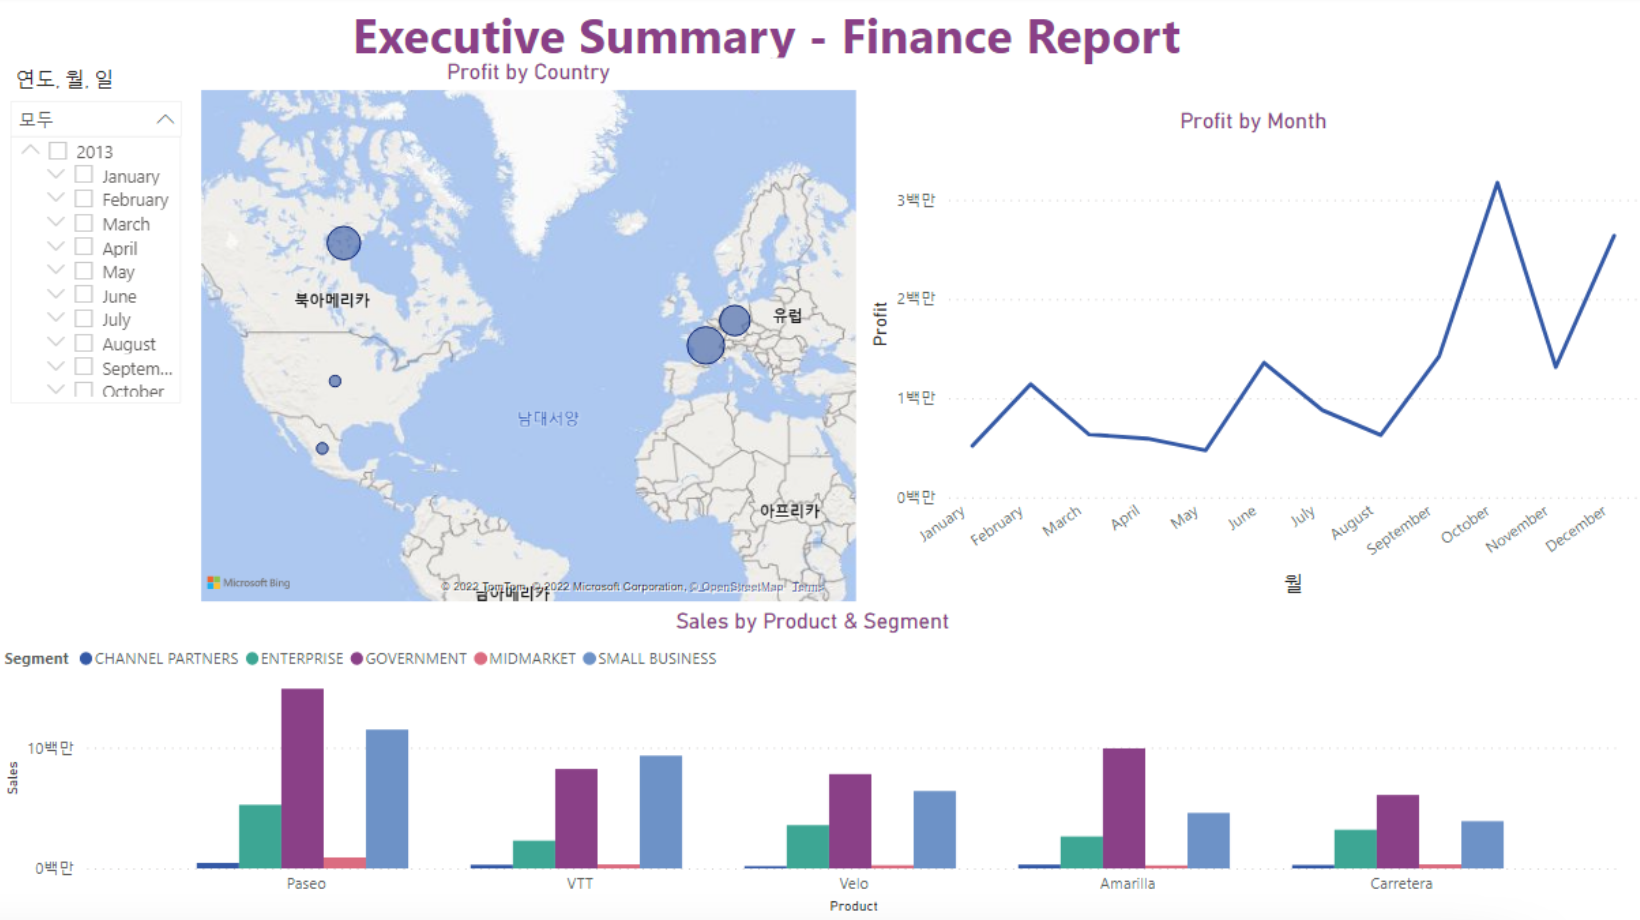
Finance Report using PowerBI

Screen Shot 2022-02-05 at 3 47 12 PM

  • Sample dataset (From Power BI) of a company's sales of products with various countries and dates
  • This dashboard answers the followings:
    • Which month/year was the most profitable?
    • In which country was the most profitable?
    • Which segment should the company invest more?
  • This dashboard is composed of the followings:
    • Map of the North America and Europe showing the amount of sales
    • Graph of profit from sales by months
    • Bar chart of sales by products/segments
  • Individual Project by Jinwoo(Roy) Yoon
Owner
Jinwoo(Roy) Yoon
Rising Senior at University of California, Berkeley Data Science (May 2023)
Jinwoo(Roy) Yoon
An open-source plotting library for statistical data.

Lets-Plot Lets-Plot is an open-source plotting library for statistical data. It is implemented using the Kotlin programming language. The design of Le

JetBrains 820 Jan 06, 2023
Python & Julia port of codes in excellent R books

X4DS This repo is a collection of Python & Julia port of codes in the following excellent R books: An Introduction to Statistical Learning (ISLR) Stat

Gitony 5 Jun 21, 2022
ipyvizzu - Jupyter notebook integration of Vizzu

ipyvizzu - Jupyter notebook integration of Vizzu. Tutorial · Examples · Repository About The Project ipyvizzu is the Jupyter Notebook integration of V

Vizzu 729 Jan 08, 2023
Bar Chart of the number of Senators from each party who are up for election in the next three General Elections

Congress-Analysis Bar Chart of the number of Senators from each party who are up for election in the next three General Elections This bar chart shows

11 Oct 26, 2021
Realtime Viewer Mandelbrot set with Python and Taichi (cpu, opengl, cuda, vulkan, metal)

Mandelbrot-set-Realtime-Viewer- Realtime Viewer Mandelbrot set with Python and Taichi (cpu, opengl, cuda, vulkan, metal) Control: "WASD" - movement, "

22 Oct 31, 2022
High-level geospatial data visualization library for Python.

geoplot: geospatial data visualization geoplot is a high-level Python geospatial plotting library. It's an extension to cartopy and matplotlib which m

Aleksey Bilogur 1k Jan 01, 2023
Open-source demos hosted on Dash Gallery

Dash Sample Apps This repository hosts the code for over 100 open-source Dash apps written in Python or R. They can serve as a starting point for your

Plotly 2.7k Jan 07, 2023
Browse Dash docsets inside emacs

Helm Dash What's it This package uses Dash docsets inside emacs to browse documentation. Here's an article explaining the basic usage of it. It doesn'

504 Dec 15, 2022
Plot and save the ground truth and predicted results of human 3.6 M and CMU mocap dataset.

Visualization-of-Human3.6M-Dataset Plot and save the ground truth and predicted results of human 3.6 M and CMU mocap dataset. human-motion-prediction

Gaurav Kumar Yadav 5 Nov 18, 2022
A python script and steps to display locations of peers connected to qbittorrent

A python script (along with instructions) to display the locations of all the peers your qBittorrent client is connected to in a Grafana worldmap dash

62 Dec 07, 2022
Design your own matplotlib stylefile interactively

Tired of playing with font sizes and other matplotlib parameters every time you start a new project or write a new plotting function? Want all you plots have the same style? Use matplotlib configurat

yobi byte 207 Dec 08, 2022
Investment and risk technologies maintained by Fortitudo Technologies.

Fortitudo Technologies Open Source This package allows you to freely explore open-source implementations of some of our fundamental technologies under

Fortitudo Technologies 11 Dec 14, 2022
This is a super simple visualization toolbox (script) for transformer attention visualization ✌

Trans_attention_vis This is a super simple visualization toolbox (script) for transformer attention visualization ✌ 1. How to prepare your attention m

Mingyu Wang 3 Jul 09, 2022
Gaphas is the diagramming widget library for Python.

Gaphas Gaphas is the diagramming widget library for Python. Gaphas is a library that provides the user interface component (widget) for drawing diagra

Gaphor 144 Dec 14, 2022
This package creates clean and beautiful matplotlib plots that work on light and dark backgrounds

This package creates clean and beautiful matplotlib plots that work on light and dark backgrounds. Inspired by the work of Edward Tufte.

Nico Schlömer 205 Jan 07, 2023
A command line tool for visualizing CSV/spreadsheet-like data

PerfPlotter Read data from CSV files using pandas and generate interactive plots using bokeh, which can then be embedded into HTML pages and served by

Gino Mempin 0 Jun 25, 2022
The open-source tool for building high-quality datasets and computer vision models

The open-source tool for building high-quality datasets and computer vision models. Website • Docs • Try it Now • Tutorials • Examples • Blog • Commun

Voxel51 2.4k Jan 07, 2023
Histogramming for analysis powered by boost-histogram

Hist Hist is an analyst-friendly front-end for boost-histogram, designed for Python 3.7+ (3.6 users get version 2.4). See what's new. Installation You

Scikit-HEP Project 97 Dec 25, 2022
Generate visualizations of GitHub user and repository statistics using GitHub Actions.

GitHub Stats Visualization Generate visualizations of GitHub user and repository statistics using GitHub Actions. This project is currently a work-in-

JoelImgu 3 Dec 14, 2022
Squidpy is a tool for the analysis and visualization of spatial molecular data.

Squidpy is a tool for the analysis and visualization of spatial molecular data. It builds on top of scanpy and anndata, from which it inherits modularity and scalability. It provides analysis tools t

Theis Lab 251 Dec 19, 2022