A Python wrapper of Neighbor Retrieval Visualizer (NeRV)

Overview

PyNeRV

A Python wrapper of the dimensionality reduction algorithm Neighbor Retrieval Visualizer (NeRV)

Compile

Set up the paths in Makefile then make.

Usage example

import numpy as np
import matplotlib.pyplot as plt
from nerv import NeRV

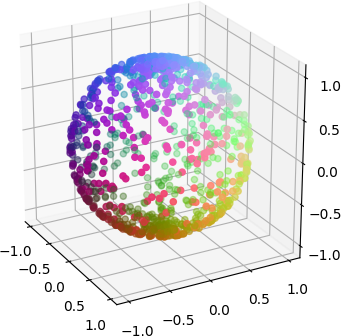
data = np.genfromtxt('dredviz-1.0.2/spheredata.dat', skip_header=1)
color = np.genfromtxt('dredviz-1.0.2/spheredata.col', skip_header=1)
nerv_obj = NeRV(random_state=0)
nerv_obj.fit(data)
print('Final cost = %g' % nerv_obj.cost_)
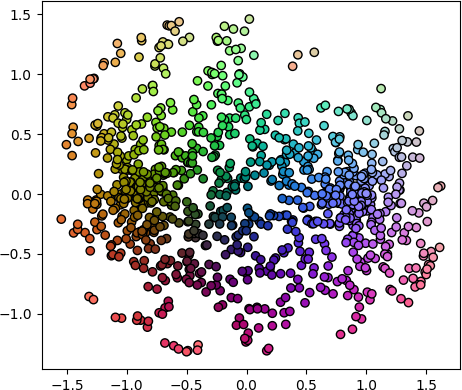
plt.scatter(*nerv_obj.embedding_.T, c=color)
plt.show()

which shows (right)


Reference

@article{venna2010information,
  title={Information retrieval perspective to nonlinear dimensionality reduction for data visualization},
  author={Venna, Jarkko and Peltonen, Jaakko and Nybo, Kristian and Aidos, Helena and Kaski, Samuel},
  journal={Journal of Machine Learning Research},
  volume={11},
  number={Feb},
  pages={451--490},
  year={2010}
}
GUI for visualization and interactive editing of SMPL-family body models ie. SMPL, SMPL-X, MANO, FLAME.

Body Model Visualizer Introduction This is a simple Open3D-based GUI for SMPL-family body models. This GUI lets you play with the shape, expression, a

Muhammed Kocabas 207 Jan 01, 2023
Create charts with Python in a very similar way to creating charts using Chart.js

Create charts with Python in a very similar way to creating charts using Chart.js. The charts created are fully configurable, interactive and modular and are displayed directly in the output of the t

Nicolas H 68 Dec 08, 2022
A high-level plotting API for pandas, dask, xarray, and networkx built on HoloViews

hvPlot A high-level plotting API for the PyData ecosystem built on HoloViews. Build Status Coverage Latest dev release Latest release Docs What is it?

HoloViz 697 Jan 06, 2023
Practical-statistics-for-data-scientists - Code repository for O'Reilly book

Code repository Practical Statistics for Data Scientists: 50+ Essential Concepts Using R and Python by Peter Bruce, Andrew Bruce, and Peter Gedeck Pub

1.7k Jan 04, 2023
patchwork for matplotlib

patchworklib patchwork for matplotlib test code Preparation of example plots import seaborn as sns import numpy as np import pandas as pd #Bri

Mori Hideto 185 Jan 06, 2023
A Python package for caclulations and visualizations in geological sciences.

geo_calcs A Python package for caclulations and visualizations in geological sciences. Free software: MIT license Documentation: https://geo-calcs.rea

Drew Heasman 1 Jul 12, 2022
Simple Python interface for Graphviz

Simple Python interface for Graphviz

Sebastian Bank 1.3k Dec 26, 2022
:bowtie: Create a dashboard with python!

Installation | Documentation | Gitter Chat | Google Group Bowtie Introduction Bowtie is a library for writing dashboards in Python. No need to know we

Jacques Kvam 753 Dec 22, 2022
TensorDebugger (TDB) is a visual debugger for deep learning. It extends TensorFlow with breakpoints + real-time visualization of the data flowing through the computational graph

TensorDebugger (TDB) is a visual debugger for deep learning. It extends TensorFlow (Google's Deep Learning framework) with breakpoints + real-time visualization of the data flowing through the comput

Eric Jang 1.4k Dec 15, 2022
termplotlib is a Python library for all your terminal plotting needs.

termplotlib termplotlib is a Python library for all your terminal plotting needs. It aims to work like matplotlib. Line plots For line plots, termplot

Nico Schlömer 553 Dec 30, 2022
An intuitive library to add plotting functionality to scikit-learn objects.

Welcome to Scikit-plot Single line functions for detailed visualizations The quickest and easiest way to go from analysis... ...to this. Scikit-plot i

Reiichiro Nakano 2.3k Dec 31, 2022
Leyna's Visualizing Data With Python

Leyna's Visualizing Data Below is information on the number of bilingual students in three school districts in Massachusetts. You will also find infor

11 Oct 28, 2021
Fast 1D and 2D histogram functions in Python

About Sometimes you just want to compute simple 1D or 2D histograms with regular bins. Fast. No nonsense. Numpy's histogram functions are versatile, a

Thomas Robitaille 237 Dec 18, 2022
Flame Graphs visualize profiled code

Flame Graphs visualize profiled code

Brendan Gregg 14.1k Jan 03, 2023
3D-Lorenz-Attractor-simulation-with-python

3D-Lorenz-Attractor-simulation-with-python Animação 3D da trajetória do Atrator de Lorenz, implementada em Python usando o método de Runge-Kutta de 4ª

Hevenicio Silva 17 Dec 08, 2022
Python scripts for plotting audiograms and related data from Interacoustics Equinox audiometer and Otoaccess software.

audiometry Python scripts for plotting audiograms and related data from Interacoustics Equinox 2.0 audiometer and Otoaccess software. Maybe similar sc

Hamilton Lab at UT Austin 2 Jun 15, 2022
Productivity Tools for Plotly + Pandas

Cufflinks This library binds the power of plotly with the flexibility of pandas for easy plotting. This library is available on https://github.com/san

Jorge Santos 2.7k Dec 30, 2022
D-Analyst : High Performance Visualization Tool

D-Analyst : High Performance Visualization Tool D-Analyst is a high performance data visualization built with python and based on OpenGL. It allows to

4 Apr 14, 2022
Pydrawer: The Python package for visualizing curves and linear transformations in a super simple way

pydrawer 📐 The Python package for visualizing curves and linear transformations in a super simple way. ✏️ Installation Install pydrawer package with

Dylan Tintenfich 56 Dec 30, 2022
Some examples with MatPlotLib library in Python

MatPlotLib Example Some examples with MatPlotLib library in Python Point: Run files only in project's directory About me Full name: Matin Ardestani Ag

Matin Ardestani 4 Mar 29, 2022