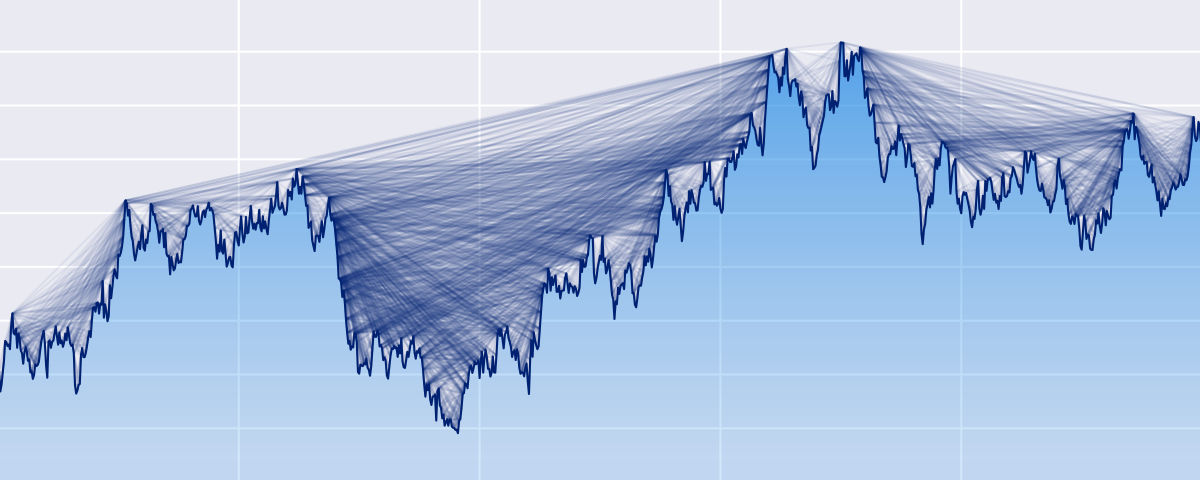
Python ts2vg package provides high-performance algorithm implementations to build visibility graphs from time series data.

Overview

ts2vg: Time series to visibility graphs

pypi pyversions wheel license

Example plot of a visibility graph


The Python ts2vg package provides high-performance algorithm implementations to build visibility graphs from time series data.

The visibility graphs and some of their properties (e.g. degree distributions) are computed quickly and efficiently, even for time series with millions of observations thanks to the use of NumPy and a custom C backend (via Cython) developed for the visibility algorithms.

The visibility graphs are provided according to the mathematical definitions described in:

  • Lucas Lacasa et al., "From time series to complex networks: The visibility graph", 2008.
  • Lucas Lacasa et al., "Horizontal visibility graphs: exact results for random time series", 2009.

An efficient divide-and-conquer algorithm is used to compute the graphs, as described in:

  • Xin Lan et al., "Fast transformation from time series to visibility graphs", 2015.

Installation

The latest released ts2vg version is available at the Python Package Index (PyPI) and can be easily installed by running:

pip install ts2vg

For other advanced uses, to build ts2vg from source Cython is required.

Basic usage

Visibility graph

Building visibility graphs from time series is very simple:

from ts2vg import NaturalVG

ts = [1.0, 0.5, 0.3, 0.7, 1.0, 0.5, 0.3, 0.8]

g = NaturalVG()
g.build(ts)

edges = g.edges

The time series passed can be a list, a tuple, or a numpy 1D array.

Horizontal visibility graph

We can also obtain horizontal visibility graphs in a very similar way:

from ts2vg import HorizontalVG

ts = [1.0, 0.5, 0.3, 0.7, 1.0, 0.5, 0.3, 0.8]

g = HorizontalVG()
g.build(ts)

edges = g.edges

Degree distribution

If we are only interested in the degree distribution of the visibility graph we can pass only_degrees=True to the build method. This will be more efficient in time and memory than computing the whole graph.

g = NaturalVG()
g.build(ts, only_degrees=True)

ks, ps = g.degree_distribution

Directed visibility graph

g = NaturalVG(directed='left_to_right')
g.build(ts)

Weighted visibility graph

g = NaturalVG(weighted='distance')
g.build(ts)

For more information and options see: Examples and API Reference.

Interoperability with other libraries

The graphs obtained can be easily converted to graph objects from other common Python graph libraries such as igraph, NetworkX and SNAP for further analysis.

The following methods are provided:

  • as_igraph()
  • as_networkx()
  • as_snap()

For example:

g = NaturalVG()
g.build(ts)

nx_g = g.as_networkx()

Command line interface

ts2vg can also be used as a command line program directly from the console:

ts2vg ./timeseries.txt -o out.edg

For more help and a list of options run:

ts2vg --help

Contributing

ts2vg can be found on GitHub. Pull requests and issue reports are welcome.

License

ts2vg is licensed under the terms of the MIT License.

You might also like...
The Spectral Diagram (SD) is a new tool for the comparison of time series in the frequency domain

The Spectral Diagram (SD) is a new tool for the comparison of time series in the frequency domain. The SD provides a novel way to display the coherence function, power, amplitude, phase, and skill score of discrete frequencies of two time series. Each SD summarises these quantities in a single plot for multiple targeted frequencies.

The windML framework provides an easy-to-use access to wind data sources within the Python world, building upon numpy, scipy, sklearn, and matplotlib. Renewable Wind Energy, Forecasting, Prediction

windml Build status : The importance of wind in smart grids with a large number of renewable energy resources is increasing. With the growing infrastr

Kglab - an abstraction layer in Python for building knowledge graphs

Graph Data Science: an abstraction layer in Python for building knowledge graphs, integrated with popular graph libraries – atop Pandas, RDFlib, pySHACL, RAPIDS, NetworkX, iGraph, PyVis, pslpython, pyarrow, etc.

Extensible, parallel implementations of t-SNE

openTSNE openTSNE is a modular Python implementation of t-Distributed Stochasitc Neighbor Embedding (t-SNE) [1], a popular dimensionality-reduction al

Extensible, parallel implementations of t-SNE

openTSNE openTSNE is a modular Python implementation of t-Distributed Stochasitc Neighbor Embedding (t-SNE) [1], a popular dimensionality-reduction al

Graphical display tools, to help students debug their class implementations in the Carcassonne family of projects

carcassonne_tools Graphical display tools, to help students debug their class implementations in the Carcassonne family of projects NOTE NOTE NOTE The

Draw interactive NetworkX graphs with Altair

nx_altair Draw NetworkX graphs with Altair nx_altair offers a similar draw API to NetworkX but returns Altair Charts instead. If you'd like to contrib

Draw interactive NetworkX graphs with Altair

nx_altair Draw NetworkX graphs with Altair nx_altair offers a similar draw API to NetworkX but returns Altair Charts instead. If you'd like to contrib

Generate graphs with NetworkX, natively visualize with D3.js and pywebview

webview_d3 This is some PoC code to render graphs created with NetworkX natively using D3.js and pywebview. The main benifit of this approac

Comments
  • help getting started

    help getting started

    I am playing around with ts2vg and I am having a hard time with the plotting using igraph. I try to compute the natural vg for a short time series, but when trying to plot it I get this error:

    Traceback (most recent call last):
      File "\anaconda3\envs\DK_01\lib\site-packages\IPython\core\interactiveshell.py", line 3398, in run_code
        exec(code_obj, self.user_global_ns, self.user_ns)
      File "<ipython-input-1-9a1fdcf342e8>", line 1, in <cell line: 1>
        ig.plot(nx_g, target='graph.pdf')
      File "\anaconda3\envs\DK_01\lib\site-packages\igraph\drawing\__init__.py", line 512, in plot
        result.save()
      File "\anaconda3\envs\DK_01\lib\site-packages\igraph\drawing\__init__.py", line 309, in save
        self._ctx.show_page()
    igraph.drawing.cairo.MemoryError: out of memory
    

    The file created is corrupted.

    Here is my code:

    import numpy as np
    from ts2vg import NaturalVG
    import igraph as ig
    
    import matplotlib.pyplot as plt
    
    # time domain
    t = np.linspace(1, 40)
    dt = np.diff(t)
    
    # build series
    x1 = np.sin(2*np.pi/10*t)
    x2 = np.sin(2*np.pi/15*t)
    
    y = x1 + x2
    
    plt.plot(t, y, '.-')
    plt.show()
    
    # build HVG
    g = NaturalVG()
    g.build(y)
    
    nx_g = g.as_igraph()
    
    # plotting
    ig.plot(nx_g, target='graph.pdf')
    

    I am using ts2vg 1.0.0, igraph 0.9.11, and pycairo 1.21.0

    opened by ACatAC 1
Releases(v1.0.0)
demir.ai Dataset Operations

demir.ai Dataset Operations With this application, you can have the empty values (nan/null) deleted or filled before giving your dataset to machine le

Ahmet Furkan DEMIR 8 Nov 01, 2022
Make visual music sheets for thatskygame (graphical representations of the Sky keyboard)

sky-python-music-sheet-maker This program lets you make visual music sheets for Sky: Children of the Light. It will ask you a few questions, and does

21 Aug 26, 2022
This is a Web scraping project using BeautifulSoup and Python to scrape basic information of all the Test matches played till Jan 2022.

Scraping-test-matches-data This is a Web scraping project using BeautifulSoup and Python to scrape basic information of all the Test matches played ti

Souradeep Banerjee 4 Oct 10, 2022
A little logger for machine learning research

Blinker Blinker provides a fast dispatching system that allows any number of interested parties to subscribe to events, or "signals". Signal receivers

Reinforcement Learning Working Group 27 Dec 03, 2022
Personal IMDB Graphs with Bokeh

Personal IMDB Graphs with Bokeh Do you like watching movies and also rate all of them in IMDB? Would you like to look at your IMDB stats based on your

2 Dec 15, 2021
web application for flight log analysis & review

Flight Review This is a web application for flight log analysis. It allows users to upload ULog flight logs, and analyze them through the browser. It

PX4 Drone Autopilot 145 Dec 20, 2022
Chem: collection of mostly python code for molecular visualization, QM/MM, FEP, etc

chem: collection of mostly python code for molecular visualization, QM/MM, FEP,

5 Sep 02, 2022
Productivity Tools for Plotly + Pandas

Cufflinks This library binds the power of plotly with the flexibility of pandas for easy plotting. This library is available on https://github.com/san

Jorge Santos 2.7k Dec 30, 2022
Mathematical learnings with Lean, for those of us who wish we knew more of both!

Lean for the Inept Mathematician This repository contains source files for a number of articles or posts aimed at explaining bite-sized mathematical c

Julian Berman 8 Feb 14, 2022
:art: Diagram as Code for prototyping cloud system architectures

Diagrams Diagram as Code. Diagrams lets you draw the cloud system architecture in Python code. It was born for prototyping a new system architecture d

MinJae Kwon 27.5k Dec 30, 2022
Material for dataviz course at university of Bordeaux

Material for dataviz course at university of Bordeaux

Nicolas P. Rougier 50 Jul 17, 2022
Learn Basic to advanced level Data visualisation techniques from this Repository

Data visualisation Hey, You can learn Basic to advanced level Data visualisation techniques from this Repository. Data visualization is the graphic re

Shashank dwivedi 16 Jan 03, 2023
With Holoviews, your data visualizes itself.

HoloViews Stop plotting your data - annotate your data and let it visualize itself. HoloViews is an open-source Python library designed to make data a

HoloViz 2.3k Jan 04, 2023
A TileDB backend for xarray.

TileDB-xarray This library provides a backend engine to xarray using the TileDB Storage Engine. Example usage: import xarray as xr dataset = xr.open_d

TileDB, Inc. 14 Jun 02, 2021
Automatization of BoxPlot graph usin Python MatPlotLib and Excel

BoxPlotGraphAutomation Automatization of BoxPlot graph usin Python / Excel. This file is an automation of BoxPlot-Graph using python graph library mat

EricAugustin 1 Feb 07, 2022
Create HTML profiling reports from pandas DataFrame objects

Pandas Profiling Documentation | Slack | Stack Overflow Generates profile reports from a pandas DataFrame. The pandas df.describe() function is great

10k Jan 01, 2023
A pandas extension that solves all problems of Jalai/Iraninan/Shamsi dates

Jalali Pandas Extentsion A pandas extension that solves all problems of Jalai/Iraninan/Shamsi dates Features Series Extenstion Convert string to Jalal

51 Jan 02, 2023
A Python toolbox for gaining geometric insights into high-dimensional data

"To deal with hyper-planes in a 14 dimensional space, visualize a 3D space and say 'fourteen' very loudly. Everyone does it." - Geoff Hinton Overview

Contextual Dynamics Laboratory 1.8k Dec 29, 2022
Graphing communities on Twitch.tv in a visually intuitive way

VisualizingTwitchCommunities This project maps communities of streamers on Twitch.tv based on shared viewership. The data is collected from the Twitch

Kiran Gershenfeld 312 Jan 07, 2023
GitHub English Top Charts

Help you discover excellent English projects and get rid of the interference of other spoken language.

kon9chunkit 529 Jan 02, 2023