Jupyter Notebook extension leveraging pandas DataFrames by integrating DataTables and ChartJS.

Overview

Jupyter DataTables

Jupyter Notebook extension to leverage pandas DataFrames by integrating DataTables JS.


About

Data scientists and in fact many developers work with pd.DataFrame on daily basis to interpret data to process them. In my typical workflow. The common workflow is to display the dataframe, take a look at the data schema and then produce multiple plots to check the distribution of the data to have a clearer picture, perhaps search some data in the table, etc...

What if those distribution plots were part of the standard DataFrame and we had the ability to quickly search through the table with minimal effort? What if it was the default representation?

The jupyter-datatables uses jupyter-require to draw the table.


Installation

pip install jupyter-datatables

Usage

import numpy as np
import pandas as pd

from jupyter_datatables import init_datatables_mode

init_datatables_mode()

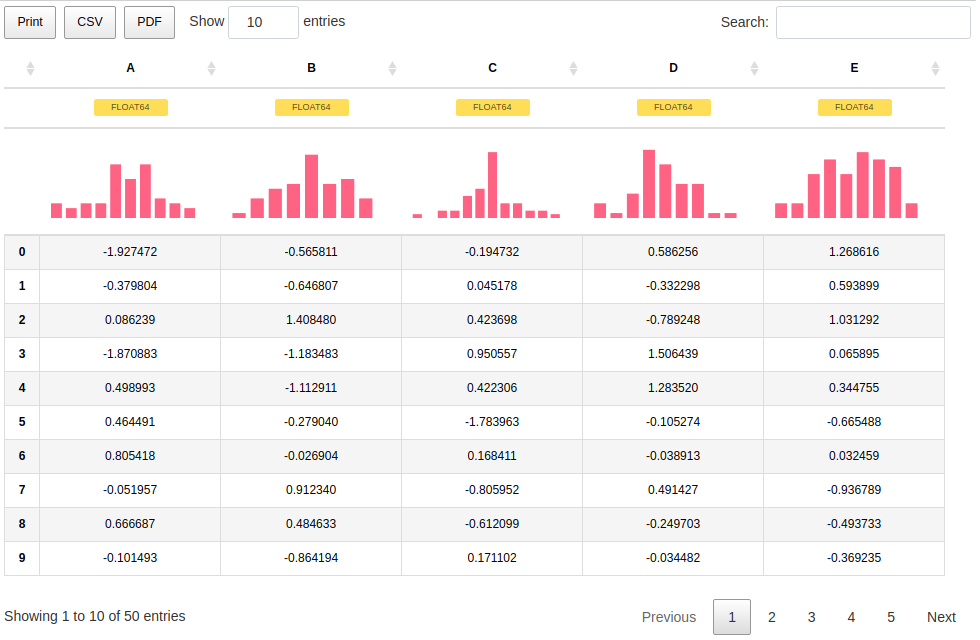
That's it, your default pandas representation will now use Jupyter DataTables!

df = pd.DataFrame(np.abs(np.random.randn(50, 5)), columns=list(string.ascii_uppercase[:5]))

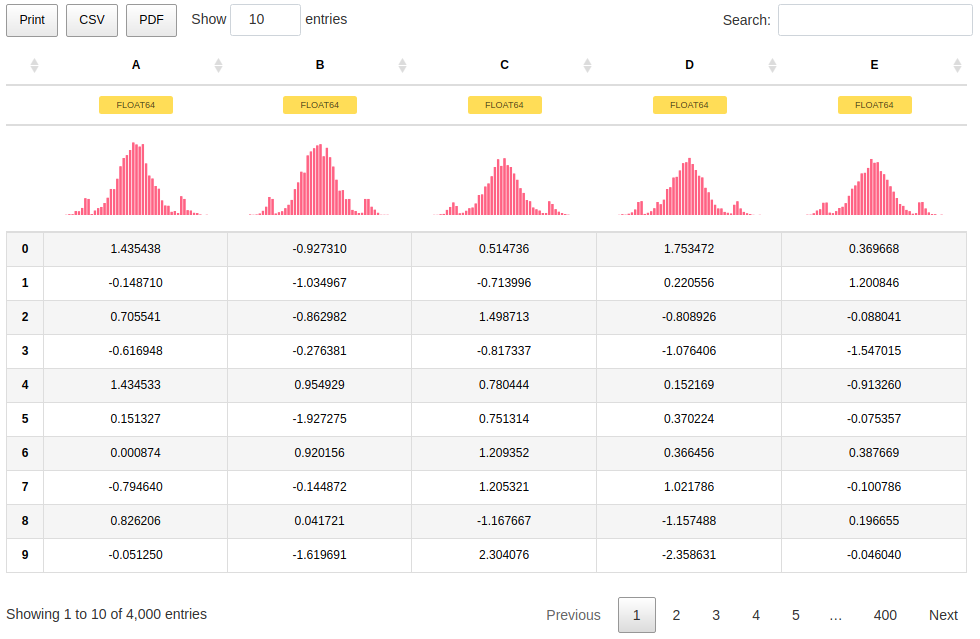
Jupyter Datatables table representation


In most cases, you don't need to worry too much about the size of your data. Jupyter DataTables calculates required sample size based on a confidence interval (by default this would be 0.95) and margin of error and ceils it to the highest 'smart' value.

For example, for a data containing 100,000 samples, given 0.975 confidence interval and 0.02 margin of error, the Jupyter DataTables would calculate that 3044 samples are required and it would round it up to 4000.

Jupyter Datatables long table sample size

With additional note:

Sample size: 4,000 out of 100,000


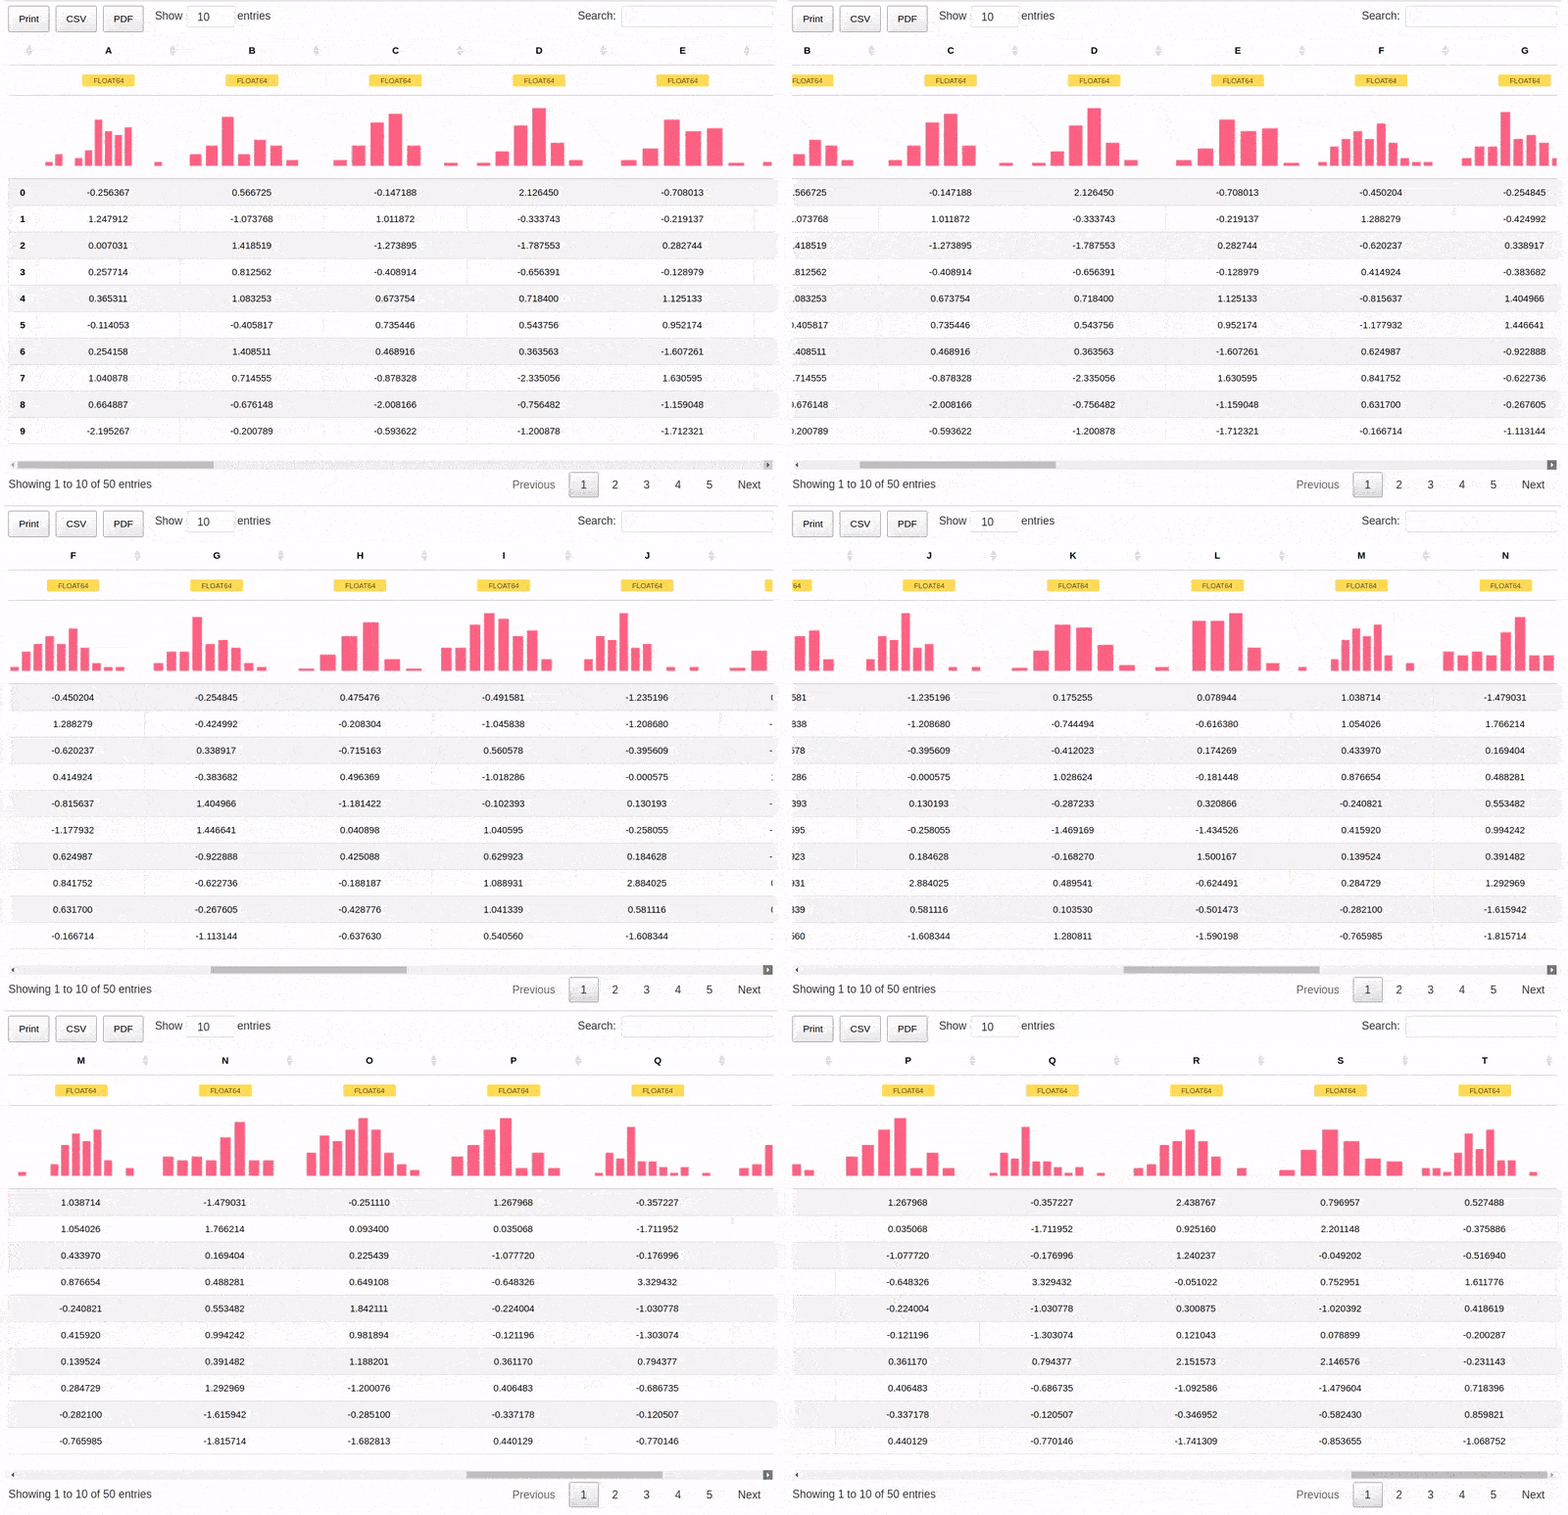
We can also handle wide tables with ease.

df = pd.DataFrame(np.abs(np.random.randn(50, 20)), columns=list(string.ascii_uppercase[:20]))

Jupyter Datatables wide table representation


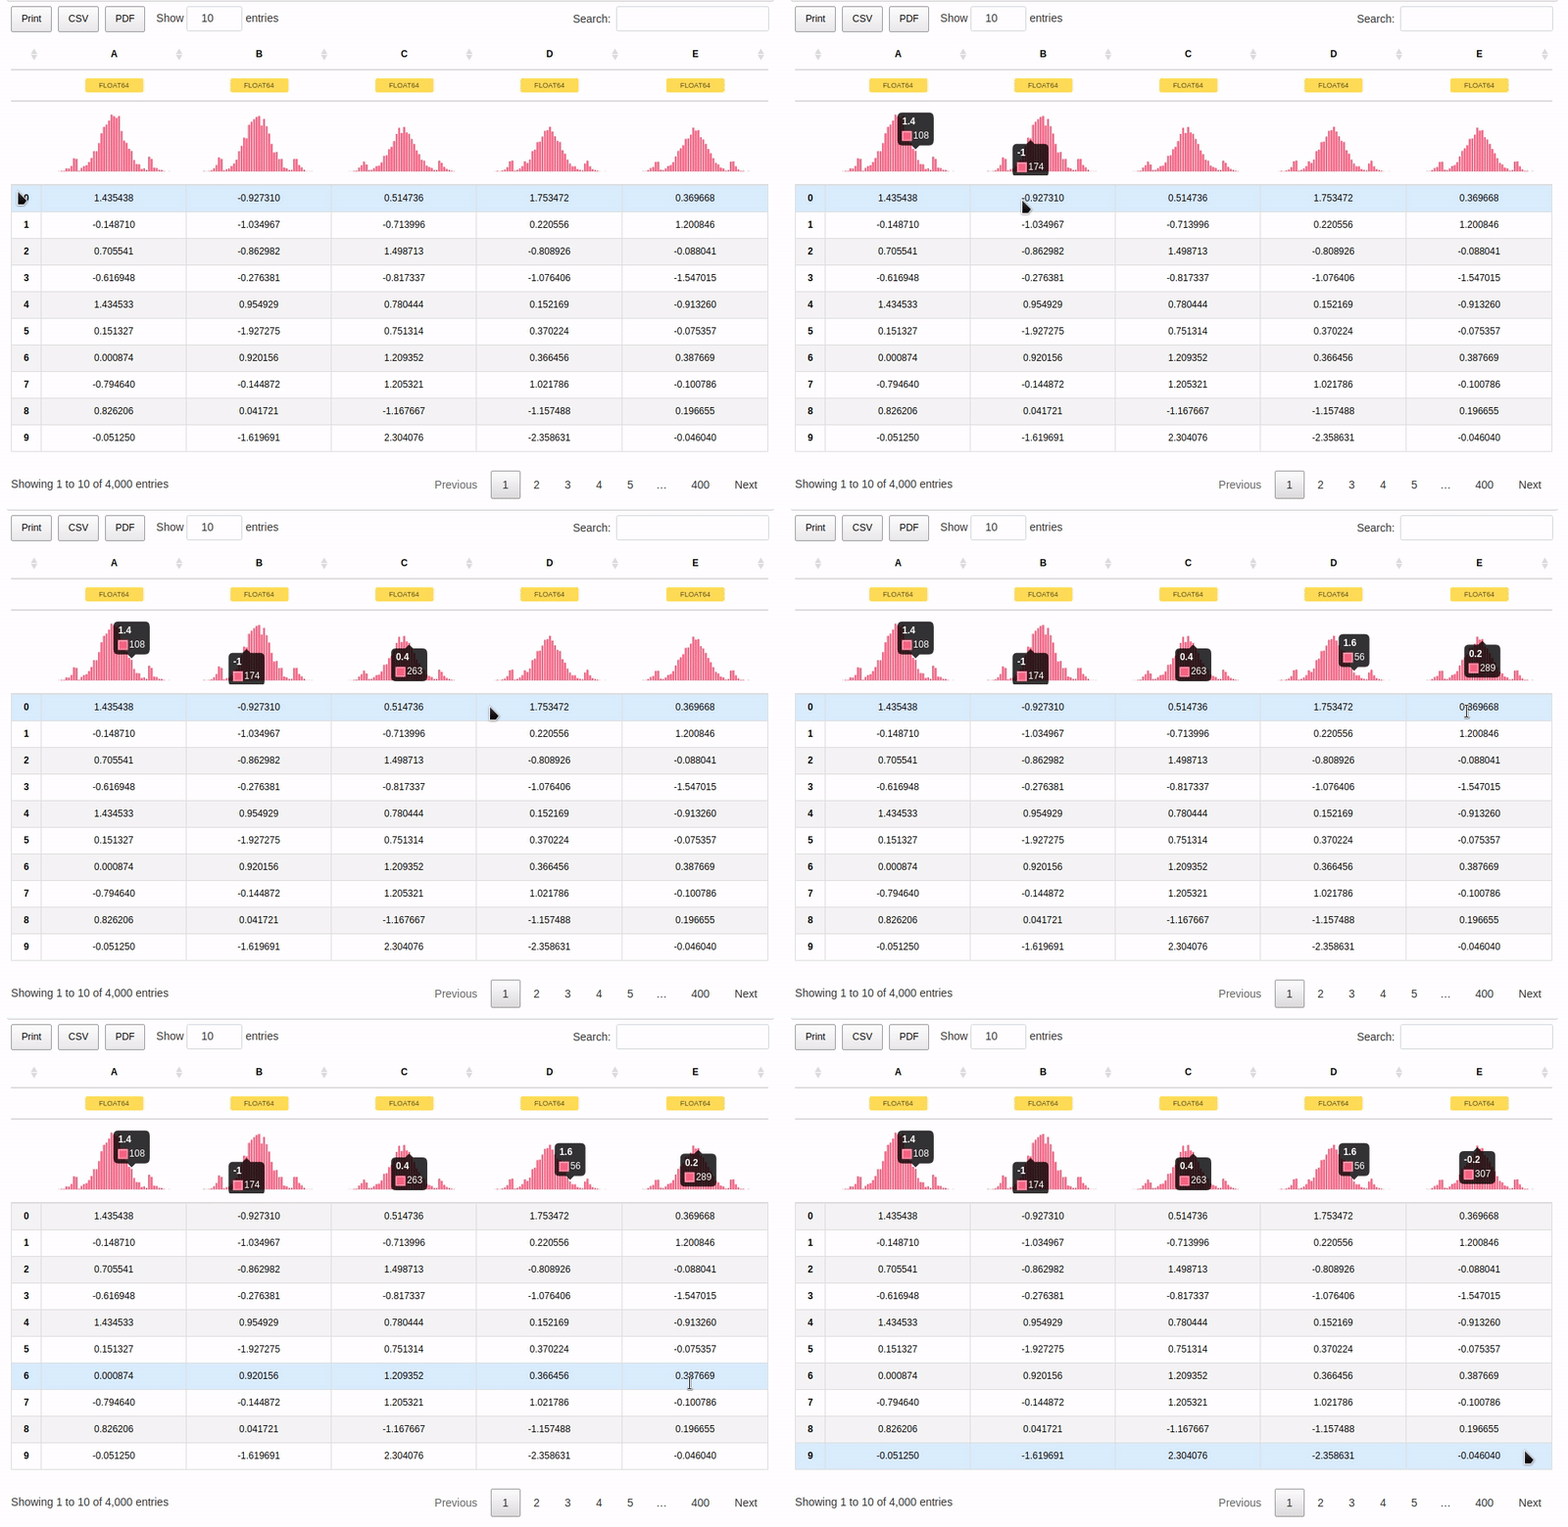
As per 0.3.0, there is a support for interactive tooltips:

Jupyter Datatables wide table representation

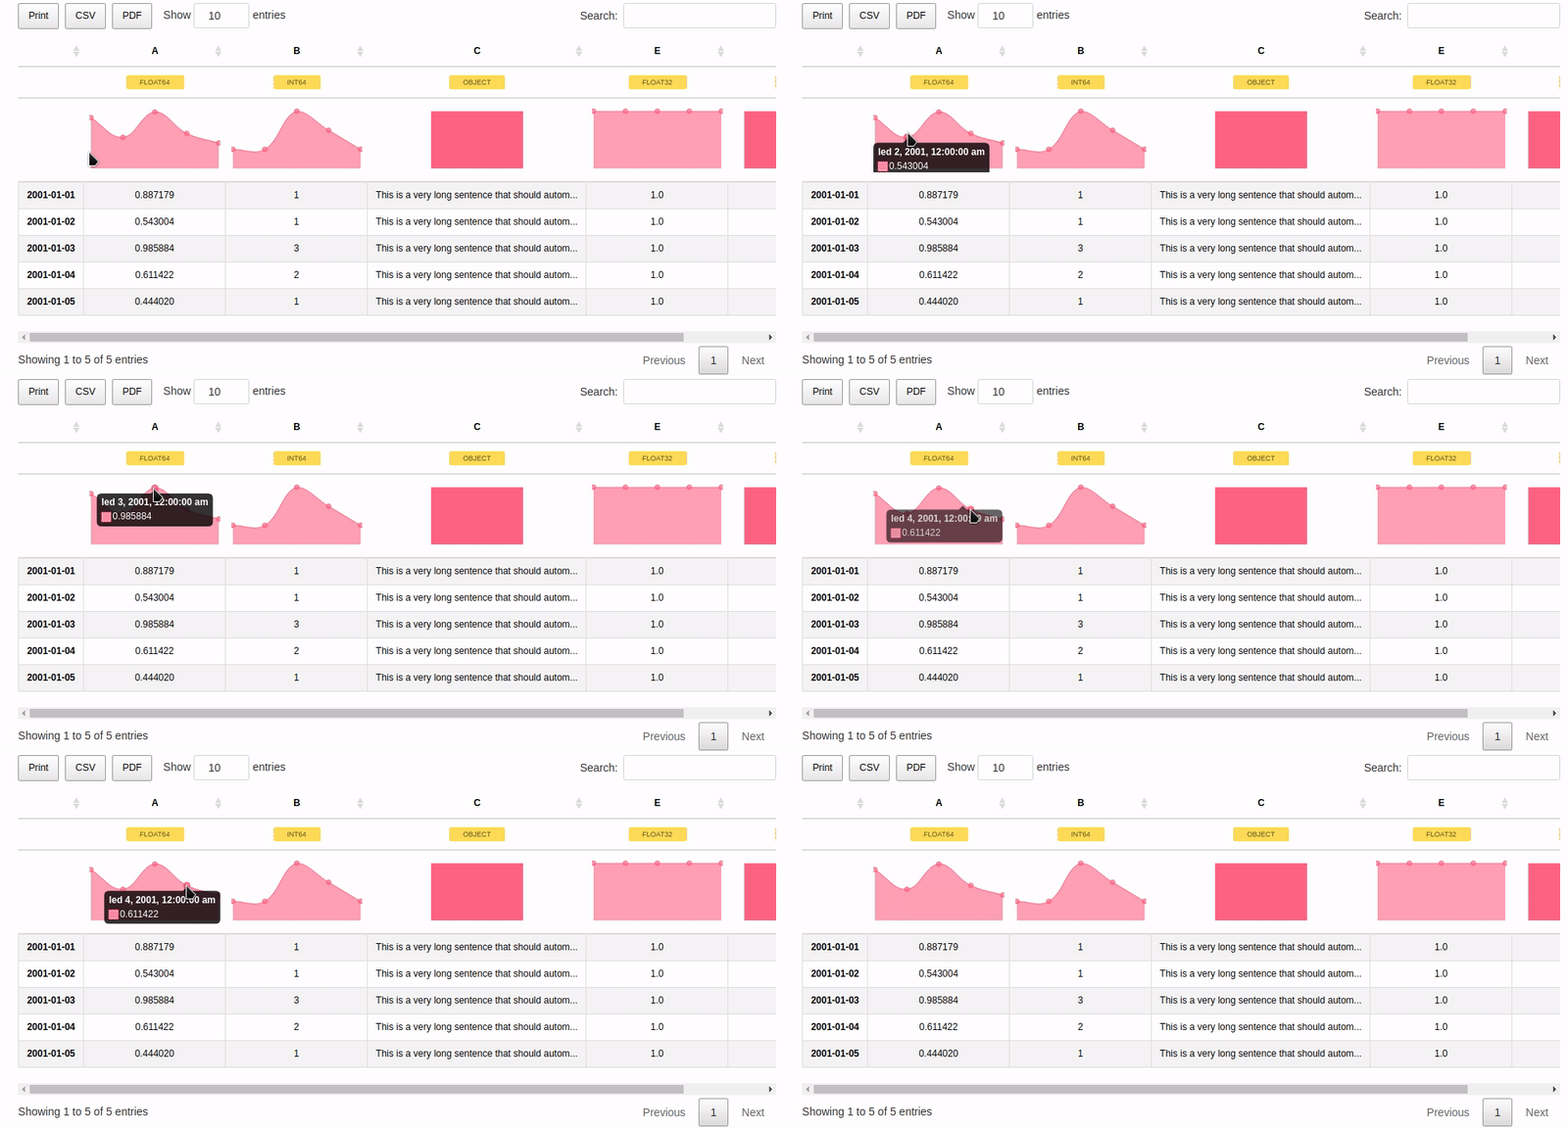
And also support for custom indices including Date type:

dft = pd.DataFrame({'A': np.random.rand(5),
                    'B': [1, 1, 3, 2, 1],
                    'C': 'This is a very long sentence that should automatically be trimmed',
                    'D': [pd.Timestamp('20010101'), pd.Timestamp('20010102'), pd.Timestamp('20010103'), pd.Timestamp('20010104'), pd.Timestamp('20010105')],
                    'E': pd.Series([1.0] * 5).astype('float32'),
                    'F': [False, True, False, False, True],
                   })

dft.D = dft.D.apply(pd.to_datetime)
dft.set_index('D', inplace=True)

Jupyter Datatables wide table representation


Current status and future plans:

Check out the Project Board where we track issues and TODOs for our Jupyter tooling!


Author: Marek Cermak [email protected], @AICoE
Owner
Marek Čermák
DevOps Engineer @ LivesportTV
Marek Čermák
A Scheil-Gulliver simulation tool using pycalphad.

scheil A Scheil-Gulliver simulation tool using pycalphad. import matplotlib.pyplot as plt from pycalphad import Database, variables as v from scheil i

pycalphad 6 Dec 10, 2021
Visualization Library

CamViz Overview // Installation // Demos // License Overview CamViz is a visualization library developed by the TRI-ML team with the goal of providing

Toyota Research Institute - Machine Learning 67 Nov 24, 2022
Fast 1D and 2D histogram functions in Python

About Sometimes you just want to compute simple 1D or 2D histograms with regular bins. Fast. No nonsense. Numpy's histogram functions are versatile, a

Thomas Robitaille 237 Dec 18, 2022
Farhad Davaripour, Ph.D. 1 Jan 05, 2022
This Crash Course will cover all you need to know to start using Plotly in your projects.

Plotly Crash Course This course was designed to help you get started using Plotly. If you ever felt like your data visualization skills could use an u

Fábio Neves 2 Aug 21, 2022
PolytopeSampler is a Matlab implementation of constrained Riemannian Hamiltonian Monte Carlo for sampling from high dimensional disributions on polytopes

PolytopeSampler PolytopeSampler is a Matlab implementation of constrained Riemannian Hamiltonian Monte Carlo for sampling from high dimensional disrib

9 Sep 26, 2022
Schema validation just got Pythonic

Schema validation just got Pythonic schema is a library for validating Python data structures, such as those obtained from config-files, forms, extern

Vladimir Keleshev 2.7k Jan 06, 2023
Using SQLite within Python to create database and analyze Starcraft 2 units data (Pandas also used)

SQLite python Starcraft 2 English This project shows the usage of SQLite with python. To create, modify and communicate with the SQLite database from

1 Dec 30, 2021
A python visualization of the A* path finding algorithm

A python visualization of the A* path finding algorithm. It allows you to pick your start, end location and make obstacles and then view the process of finding the shortest path. You can also choose

Kimeon 4 Aug 02, 2022
script to generate HeN ipfs app exports of GLSL shaders

HeNerator A simple script to generate HeN ipfs app exports from any frag shader created with: GlslViewer GlslEditor The Book of Shaders glslCanvas VS

Patricio Gonzalez Vivo 22 Dec 21, 2022
Plotting library for IPython/Jupyter notebooks

bqplot 2-D plotting library for Project Jupyter Introduction bqplot is a 2-D visualization system for Jupyter, based on the constructs of the Grammar

3.4k Dec 30, 2022
view cool stats related to your discord account.

DiscoStats cool statistics generated using your discord data. How? DiscoStats is not a service that breaks the Discord Terms of Service or Community G

ibrahim hisham 5 Jun 02, 2022
Practical-statistics-for-data-scientists - Code repository for O'Reilly book

Code repository Practical Statistics for Data Scientists: 50+ Essential Concepts Using R and Python by Peter Bruce, Andrew Bruce, and Peter Gedeck Pub

1.7k Jan 04, 2023
649 Pokémon palettes as CSVs, with a Python lib to turn names/IDs into palettes, or MatPlotLib compatible ListedColormaps.

PokePalette 649 Pokémon, broken down into CSVs of their RGB colour palettes. Complete with a Python library to convert names or Pokédex IDs into eithe

11 Dec 05, 2022
Python library that makes it easy for data scientists to create charts.

Chartify Chartify is a Python library that makes it easy for data scientists to create charts. Why use Chartify? Consistent input data format: Spend l

Spotify 3.2k Jan 01, 2023
Use Perspective to create the chart for the trader’s dashboard

Task Overview | Installation Instructions | Link to Module 3 Introduction Experience Technology at JP Morgan Chase Try out what real work is like in t

Abdulazeez Jimoh 1 Jan 22, 2022
Datapane is the easiest way to create data science reports from Python.

Datapane Teams | Documentation | API Docs | Changelog | Twitter | Blog Share interactive plots and data in 3 lines of Python. Datapane is a Python lib

Datapane 744 Jan 06, 2023
A Python package that provides evaluation and visualization tools for the DexYCB dataset

DexYCB Toolkit DexYCB Toolkit is a Python package that provides evaluation and visualization tools for the DexYCB dataset. The dataset and results wer

NVIDIA Research Projects 107 Dec 26, 2022
Python script for writing text on github contribution chart.

Github Contribution Drawer Python script for writing text on github contribution chart. Requirements Python 3.X Getting Started Create repository Put

Steven 0 May 27, 2022
Visualize your pandas data with one-line code

PandasEcharts 简介 基于pandas和pyecharts的可视化工具 安装 pip 安装 $ pip install pandasecharts 源码安装 $ git clone https://github.com/gamersover/pandasecharts $ cd pand

陈华杰 2 Apr 13, 2022