Project: Netflix Data Analysis and Visualization with Python

Overview

Project: Netflix Data Analysis and Visualization with Python

MyNetflixDashboard

Table of Contents

  1. General Info
  2. Installation
  3. Demo
  4. Usage and Main Functionalities
  5. Contributing

General Info

This is a compact Data Visualization project I worked on for fun and to deepen my knowledge about visualizations and graphs using python libraries.

From conception and design to every line of code, the entire Dashboard was worked on by myself. During this project, I was able to repeat and deepen what I had previously learned in my Data Science course of study. Especially, I was able to familiarize myself with pandas and work on my data visualization skills, which I greatly enjoied!

The dataset I used for the Netflix data analytics task consists of my personal Netflix data, which I requested through their website. You can get access to your own data through this link. Feel free to download it and use my code to look into your own viewing behaviour :)

Installation

Requirements: Make sure you have Python 3.7+ installed on your computer. You can download the latest version of Python here.

Req. Packages:

  • pandas
  • dash
  • dash_bootstrap_components
  • ploty.express
  • plotly.graph_objects

Demo

Demo_MyNetflixDashboard_komprimiert.mov

Usage and Main Functionalities

Want to know more about your own Netflix behaviour? For test usage you can download your own Netflix data. Just follow this link and Netflix will send you your personal data.

Please also refer to the comments within the code itself to get more information on the functionalities of the program.


0. Preparing the data for analysis

  • This part cleans up the original data and prepares it for analysis.
  • In the process, columns that are not needed are dropped.
  • Time data is converted into appropriate time formats and split into several columns. The days of the week are added.
  • In addition, the titles of the movies/series are split (title, season number, episode name).

1. Analysis

  • This part of the code is about analyzing the data.
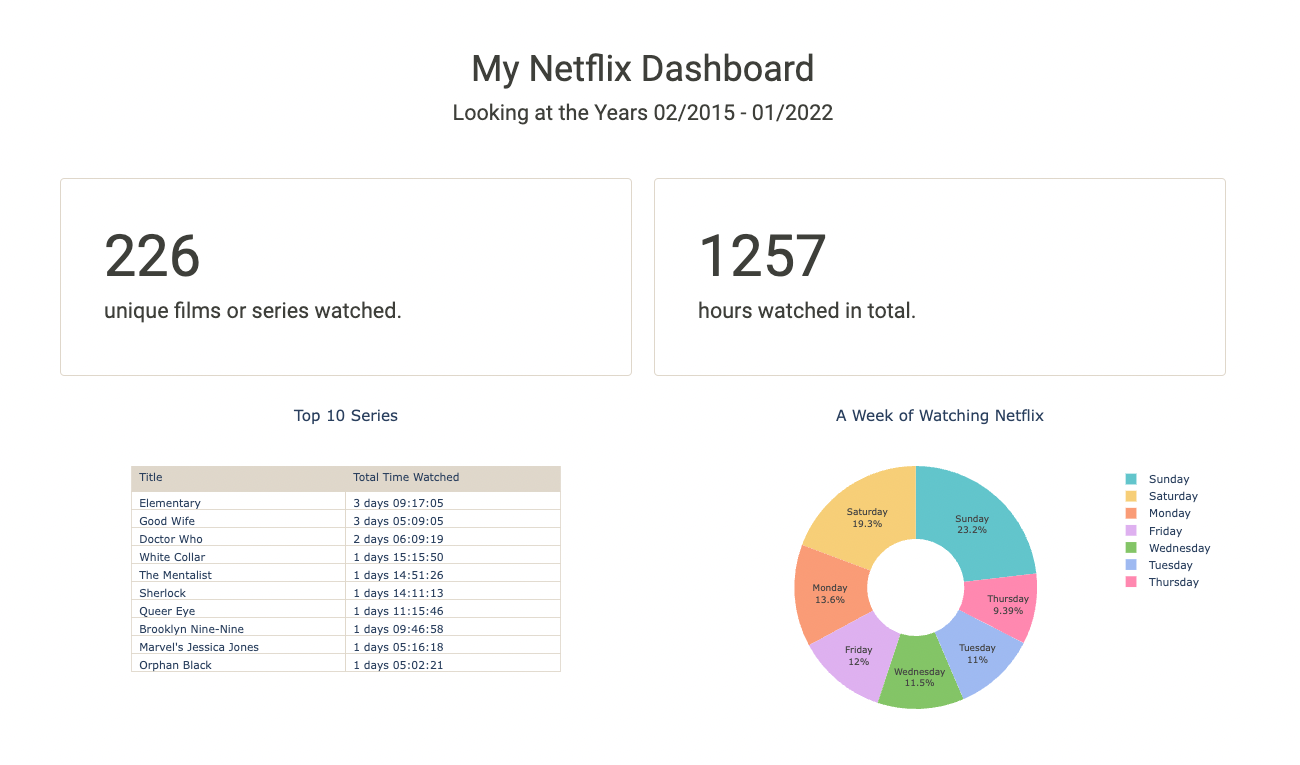
  • We find out how many movies or series were watched over the entire period. We also count the total number of hours Netflix was watched.
  • A pie chart is created that shows which days of the week are watched.
  • In addition, the top 10 series that were watched the longest (in terms of total duration) are displayed.
  • A line chart shows Netflix viewing behavior over the years, counting the total number of hours Netflix was watched.

NetflixOverTime

2. Dash App Layout

  • plotly's Dash is now used to create an Interactive Dashboard of Netflix data.
  • The individual graphics and texts are arranged in rows and containers.
  • This part also includes a dropdown menu that the user can interact with.

3. App Callback

  • Here we connect an interactive bar chart to the Dash Components.
  • The chart represents our total annual hours of Netflix watched, grouped by month. The chart is filterable by year.

MonthlyViews

Contributing

Your comments, suggestions, and contributions are welcome. Please feel free to contribute pull requests or create issues for bugs and feature requests.
Owner
Kathrin Hälbich
Data Science Student and PR- & Marketing-Expert
Kathrin Hälbich
Pandas on AWS - Easy integration with Athena, Glue, Redshift, Timestream, QuickSight, Chime, CloudWatchLogs, DynamoDB, EMR, SecretManager, PostgreSQL, MySQL, SQLServer and S3 (Parquet, CSV, JSON and EXCEL).

AWS Data Wrangler Pandas on AWS Easy integration with Athena, Glue, Redshift, Timestream, QuickSight, Chime, CloudWatchLogs, DynamoDB, EMR, SecretMana

Amazon Web Services - Labs 3.3k Jan 04, 2023
BasstatPL is a package for performing different tabulations and calculations for descriptive statistics.

BasstatPL is a package for performing different tabulations and calculations for descriptive statistics. It provides: Frequency table constr

Angel Chavez 1 Oct 31, 2021
ELFXtract is an automated analysis tool used for enumerating ELF binaries

ELFXtract ELFXtract is an automated analysis tool used for enumerating ELF binaries Powered by Radare2 and r2ghidra This is specially developed for PW

Monish Kumar 49 Nov 28, 2022
Data Competition: automated systems that can detect whether people are not wearing masks or are wearing masks incorrectly

Table of contents Introduction Dataset Model & Metrics How to Run Quickstart Install Training Evaluation Detection DATA COMPETITION The COVID-19 pande

Thanh Dat Vu 1 Feb 27, 2022
Building house price data pipelines with Apache Beam and Spark on GCP

This project contains the process from building a web crawler to extract the raw data of house price to create ETL pipelines using Google Could Platform services.

1 Nov 22, 2021
🌍 Create 3d-printable STLs from satellite elevation data 🌏

mapa 🌍 Create 3d-printable STLs from satellite elevation data Installation pip install mapa Usage mapa uses numpy and numba under the hood to crunch

Fabian Gebhart 13 Dec 15, 2022
A python package which can be pip installed to perform statistics and visualize binomial and gaussian distributions of the dataset

GBiStat package A python package to assist programmers with data analysis. This package could be used to plot : Binomial Distribution of the dataset p

Rishikesh S 4 Oct 17, 2022
Multiple Pairwise Comparisons (Post Hoc) Tests in Python

scikit-posthocs is a Python package that provides post hoc tests for pairwise multiple comparisons that are usually performed in statistical data anal

Maksim Terpilowski 264 Dec 30, 2022
Data imputations library to preprocess datasets with missing data

Impyute is a library of missing data imputation algorithms. This library was designed to be super lightweight, here's a sneak peak at what impyute can do.

Elton Law 329 Dec 05, 2022
Statistical Rethinking: A Bayesian Course Using CmdStanPy and Plotnine

Statistical Rethinking: A Bayesian Course Using CmdStanPy and Plotnine Intro This repo contains the python/stan version of the Statistical Rethinking

Andrés Suárez 3 Nov 08, 2022
Data collection, enhancement, and metrics calculation.

l3_data_collection Data collection, enhancement, and metrics calculation. Summary Repository containing code for QuantDAO's JDT data collection task.

Ruiwyn 3 Dec 23, 2022
A Pythonic introduction to methods for scaling your data science and machine learning work to larger datasets and larger models, using the tools and APIs you know and love from the PyData stack (such as numpy, pandas, and scikit-learn).

This tutorial's purpose is to introduce Pythonistas to methods for scaling their data science and machine learning work to larger datasets and larger models, using the tools and APIs they know and lo

Coiled 102 Nov 10, 2022
An ETL framework + Monitoring UI/API (experimental project for learning purposes)

Fastlane An ETL framework for building pipelines, and Flask based web API/UI for monitoring pipelines. Project structure fastlane |- fastlane: (ETL fr

Dan Katz 2 Jan 06, 2022
A powerful data analysis package based on mathematical step functions. Strongly aligned with pandas.

The leading use-case for the staircase package is for the creation and analysis of step functions. Pretty exciting huh. But don't hit the close button

48 Dec 21, 2022
Flenser is a simple, minimal, automated exploratory data analysis tool.

Flenser Have you ever been handed a dataset you've never seen before? Flenser is a simple, minimal, automated exploratory data analysis tool. It runs

John McCambridge 79 Sep 20, 2022
Randomisation-based inference in Python based on data resampling and permutation.

Randomisation-based inference in Python based on data resampling and permutation.

67 Dec 27, 2022
A neural-based binary analysis tool

A neural-based binary analysis tool Introduction This directory contains the demo of a neural-based binary analysis tool. We test the framework using

Facebook Research 208 Dec 22, 2022
The lastest all in one bombing tool coded in python uses tbomb api

BaapG-Attack is a python3 based script which is officially made for linux based distro . It is inbuit mass bomber with sms, mail, calls and many more bombing

59 Dec 25, 2022
Sample code for Harry's Airflow online trainng course

Sample code for Harry's Airflow online trainng course You can find the videos on youtube or bilibili. I am working on adding below things: the slide p

102 Dec 30, 2022