PyPassword is a simple follow up to PyPassphrase

Overview

PyPassword

PyPassword is a simple follow up to PyPassphrase. After finishing that project it occured to me that while some may wish to use that option, may not be able to do so due to pre-defined password requirements (for example, spaces not allowed or an arbitrary limit on the number of characters). Therefore, it seemed reasonable to create a more traditional password generator but wrap it also in a GUI frontend with PySimpleGUI.

There is nothing particularly special about this application past its compliment to PyPassphrase. In fact, I will likely merge the two applications so that both options exist in one.

Stay Tuned!

In the meantime, if you choose to use this as a stand-alone password generator keep in mind no attempts are made to make the resulting passwords easier to remember and it is highly recommended that you use a trusted and secure password manager such as Keepass or Linux Pass to store and manage the passwords.

The passwords are generated using the Python string library using lowercase, uppercase, digits and punctuation characters. Which group is used is chosen at random using the Python secrets library. A loop is used to randomize the list of characters and then from that list a random sample is taken that is the length of the password specified.

The result is some truly cyrptic passwords that, if using sufficient length (generally 15 characters or more), will be strong enough for most applications.

Currently only the command line option exists to launch the application and that for only Linux at the moment. To use the application simply download the binary and from the location where it is saved launch a terminal session and run the command ./pypassword. This will launch the GUI frontend.

Screenshots

You might also like...
A simple script that displays pixel-based animation on GitHub Activity

GitHub Activity Animator This project contains a simple Javascript snippet that produces an animation on your GitHub activity tracker. The project als

A simple python tool for explore your object detection dataset

A simple tool for explore your object detection dataset. The goal of this library is to provide simple and intuitive visualizations from your dataset and automatically find the best parameters for generating a specific grid of anchors that can fit you data characteristics

A deceptively simple plotting library for Streamlit

🍅 Plost A deceptively simple plotting library for Streamlit. Because you've been writing plots wrong all this time. Getting started pip install plost

Simple spectra visualization tool for astronomers

SpecViewer A simple visualization tool for astronomers. Dependencies Python = 3.7.4 PyQt5 = 5.15.4 pyqtgraph == 0.10.0 numpy = 1.19.4 How to use py

Simple CLI python app to show a stocks graph performance. Made with Matplotlib and Tiingo.

stock-graph-python Simple CLI python app to show a stocks graph performance. Made with Matplotlib and Tiingo. Tiingo API Key You will need to add your

Simple Inkscape Scripting

Simple Inkscape Scripting Description In the Inkscape vector-drawing program, how would you go about drawing 100 diamonds, each with a random color an

eoplatform is a Python package that aims to simplify Remote Sensing Earth Observation by providing actionable information on a wide swath of RS platforms and provide a simple API for downloading and visualizing RS imagery

An Earth Observation Platform Earth Observation made easy. Report Bug | Request Feature About eoplatform is a Python package that aims to simplify Rem

simple tool to paint axis x and y

simple tool to paint axis x and y

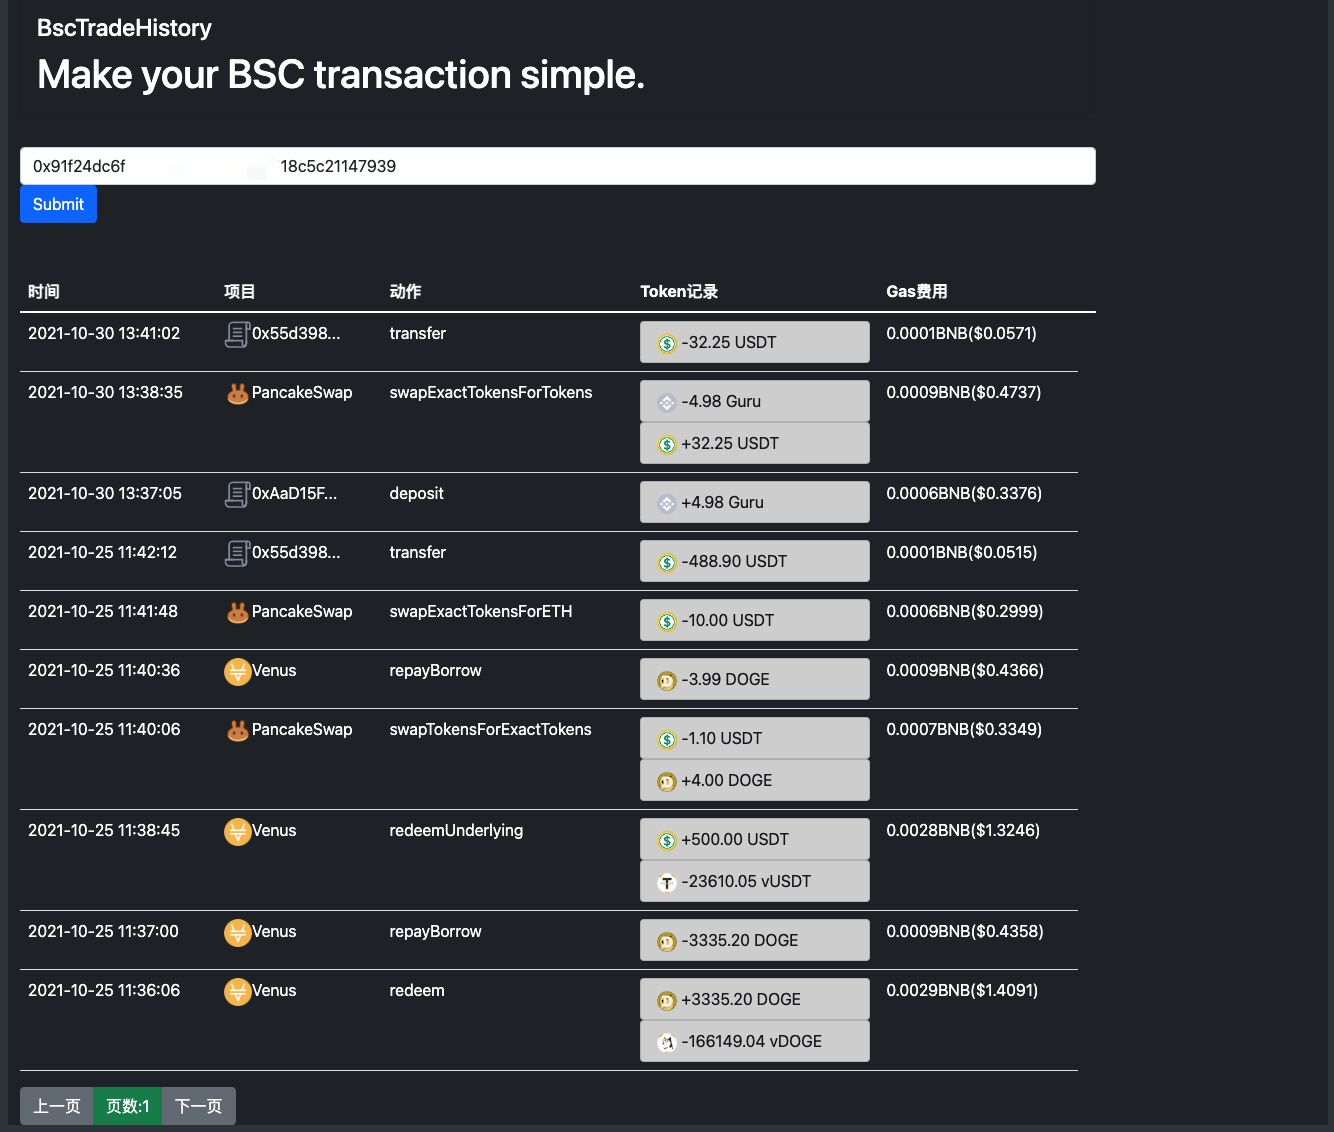
Make your BSC transaction simple.

bsc_trade_history Make your BSC transaction simple. 中文ReadMe Background: inspired by debank ,Practice my hands on this small project Blog:Crypto-BscTr

Comments
Releases(v1.1.0)
Owner
Scotty
Scotty
An application that allows you to design and test your own stock trading algorithms in an attempt to beat the market.

StockBot is a Python application for designing and testing your own daily stock trading algorithms. Installation Use the

Ryan Cullen 280 Dec 19, 2022
Minimal Ethereum fee data viewer for the terminal, contained in a single python script.

Minimal Ethereum fee data viewer for the terminal, contained in a single python script. Connects to your node and displays some metrics in real-time.

48 Dec 05, 2022
Bar Chart of the number of Senators from each party who are up for election in the next three General Elections

Congress-Analysis Bar Chart of the number of Senators from each party who are up for election in the next three General Elections This bar chart shows

11 Oct 26, 2021
Focus on Algorithm Design, Not on Data Wrangling

The dataTap Python library is the primary interface for using dataTap's rich data management tools. Create datasets, stream annotations, and analyze model performance all with one library.

Zensors 37 Nov 25, 2022
Apache Superset is a Data Visualization and Data Exploration Platform

Superset A modern, enterprise-ready business intelligence web application. Why Superset? | Supported Databases | Installation and Configuration | Rele

The Apache Software Foundation 50k Jan 06, 2023
3D Vision functions with end-to-end support for deep learning developers, written in Ivy.

Ivy vision focuses predominantly on 3D vision, with functions for camera geometry, image projections, co-ordinate frame transformations, forward warping, inverse warping, optical flow, depth triangul

Ivy 61 Dec 29, 2022
Python package for the analysis and visualisation of finite-difference fields.

discretisedfield Marijan Beg1,2, Martin Lang2, Samuel Holt3, Ryan A. Pepper4, Hans Fangohr2,5,6 1 Department of Earth Science and Engineering, Imperia

ubermag 12 Dec 14, 2022
Parse Robinhood 1099 Tax Document from PDF into CSV

Robinhood 1099 Parser This project converts Robinhood Securities 1099 tax document from PDF to CSV file. This tool will be helpful for those who need

Keun Tae (Kevin) Park 52 Jun 10, 2022
The Timescale NFT Starter Kit is a step-by-step guide to get up and running with collecting, storing, analyzing and visualizing NFT data from OpenSea, using PostgreSQL and TimescaleDB.

Timescale NFT Starter Kit The Timescale NFT Starter Kit is a step-by-step guide to get up and running with collecting, storing, analyzing and visualiz

Timescale 102 Dec 24, 2022
Matplotlib colormaps from the yt project !

cmyt Matplotlib colormaps from the yt project ! Colormaps overview The following colormaps, as well as their respective reversed (*_r) versions are av

The yt project 5 Sep 16, 2022
This is a sorting visualizer made with Tkinter.

Sorting-Visualizer This is a sorting visualizer made with Tkinter. Make sure you've installed tkinter in your system to use this visualizer pip instal

Vishal Choubey 7 Jul 06, 2022
A Python wrapper of Neighbor Retrieval Visualizer (NeRV)

PyNeRV A Python wrapper of the dimensionality reduction algorithm Neighbor Retrieval Visualizer (NeRV) Compile Set up the paths in Makefile then make.

2 Aug 29, 2021
With Holoviews, your data visualizes itself.

HoloViews Stop plotting your data - annotate your data and let it visualize itself. HoloViews is an open-source Python library designed to make data a

HoloViz 2.3k Jan 02, 2023
These data visualizations were created as homework for my CS40 class. I hope you enjoy!

Data Visualizations These data visualizations were created as homework for my CS40 class. I hope you enjoy! Nobel Laureates by their Country of Birth

9 Sep 02, 2022
JupyterHub extension for ContainDS Dashboards

ContainDS Dashboards for JupyterHub A Dashboard publishing solution for Data Science teams to share results with decision makers. Run a private on-pre

Ideonate 179 Nov 29, 2022
Decision Border Visualizer for Classification Algorithms

dbv Decision Border Visualizer for Classification Algorithms Project description A python package for Machine Learning Engineers who want to visualize

Sven Eschlbeck 1 Nov 01, 2021
Use Perspective to create the chart for the trader’s dashboard

Task Overview | Installation Instructions | Link to Module 3 Introduction Experience Technology at JP Morgan Chase Try out what real work is like in t

Abdulazeez Jimoh 1 Jan 22, 2022
Print matplotlib colors

mplcolors Tired of searching "matplotlib colors" every week/day/hour? This simple script displays them all conveniently right in your terminal emulato

Brandon Barker 32 Dec 13, 2022
Function Plotter: a simple application with GUI to plot mathematical functions

Function-Plotter Function Plotter is a simple application with GUI to plot mathe

Mohamed Nabawe 4 Jan 03, 2022
Scientific measurement library for instruments, experiments, and live-plotting

PyMeasure scientific package PyMeasure makes scientific measurements easy to set up and run. The package contains a repository of instrument classes a

PyMeasure 445 Jan 04, 2023