A simple agent-based model used to teach the basics of OOP in my lectures

Overview

Pydemic

A simple agent-based model of a pandemic.

This is used to teach basic principles of object-oriented programming to master students.

It is not at all optimized for performance and does not have any predictive skill.

Based on an original idea by Georg Wohlfahrt.

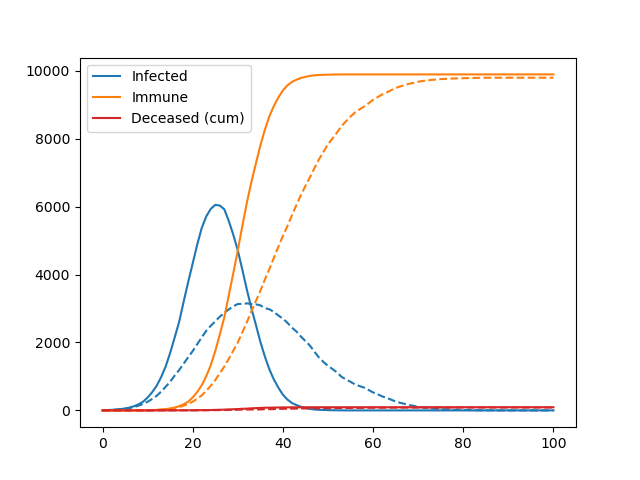
image

Rules

We are simulating a square 2-dimensional (nx x nx pixel) domain which is populated by a maximum number of agents (na), i.e. human individuals. The initial position of the agents on the domain is determined with a pseudo-random number generator. Two or more agents may populate the same pixel.

The simulation runs to a maximum of nt time steps. During every time step each agent may move a maximum number of pixels in the horizontal (x) and vertical (y) direction, as determined by the movemax parameter. If movemax = 2, this means that agents may move between -2 and +2 pixels in the x/y-direction – the actual number of moves within these limits is again determined with the random number generator.

If the random moves would cause an agent to leave the domain, the agent is perfectly “reflected” into the domain, i.e. if a random move would bring an agent to the position nx + 2, the position is corrected to nx – 2.

At the start of the simulation, a number n_initial_infected of randomly selected agents carries the virus.

If two or more agents meet on the same pixel and at least one of them is infected there is a certain probability (probability_of_infection) that non-infected, non-immune agents become infected. This dice roll is repeated for each infected agent at this location.

If infected, agents remain infectious until they recover (time_until_recovery). At the end of the infection period, there is also some probability that agents do not recover, but instead decease (mortality_rate), which reduces the total number of agents on the domain. After recovery, the past infection conveys immunity from another infection.

Potential improvements

There are many. See exercises on the topic.

Getting started

Download the code and run pydemic.py in the terminal or in the ipython interpreter.

TODO Fabien

  • Write tests.
  • Add a visualisation of the spatial domain (with density plots or similar).
Owner
Fabien Maussion
Climate, glaciers, and programming.
Fabien Maussion
Show Data: Show your dataset in web browser!

Show Data is to generate html tables for large scale image dataset, especially for the dataset in remote server. It provides some useful commond line tools and fully customizeble API reference to gen

Dechao Meng 83 Nov 26, 2022
coordinate to draw the nimbus logo on the graffitiwall

This is a community effort to draw the nimbus logo on beaconcha.in's graffitiwall. get started clone repo with git clone https://github.com/tennisbowl

4 Apr 04, 2022
Import, visualize, and analyze SpiderFoot OSINT data in Neo4j, a graph database

SpiderFoot Neo4j Tools Import, visualize, and analyze SpiderFoot OSINT data in Neo4j, a graph database Step 1: Installation NOTE: This installs the sf

Black Lantern Security 42 Dec 26, 2022
Flame Graphs visualize profiled code

Flame Graphs visualize profiled code

Brendan Gregg 14.1k Jan 03, 2023
Practical-statistics-for-data-scientists - Code repository for O'Reilly book

Code repository Practical Statistics for Data Scientists: 50+ Essential Concepts Using R and Python by Peter Bruce, Andrew Bruce, and Peter Gedeck Pub

1.7k Jan 04, 2023
MPL Plotter is a Matplotlib based Python plotting library built with the goal of delivering publication-quality plots concisely.

MPL Plotter is a Matplotlib based Python plotting library built with the goal of delivering publication-quality plots concisely.

Antonio López Rivera 162 Nov 11, 2022
A toolkit to generate MR sequence diagrams

mrsd: a toolkit to generate MR sequence diagrams mrsd is a Python toolkit to generate MR sequence diagrams, as shown below for the basic FLASH sequenc

Julien Lamy 3 Dec 25, 2021
Print matplotlib colors

mplcolors Tired of searching "matplotlib colors" every week/day/hour? This simple script displays them all conveniently right in your terminal emulato

Brandon Barker 32 Dec 13, 2022
This is a web application to visualize various famous technical indicators and stocks tickers from user

Visualizing Technical Indicators Using Python and Plotly. Currently facing issues hosting the application on heroku. As soon as I am able to I'll like

4 Aug 04, 2022
An application that allows you to design and test your own stock trading algorithms in an attempt to beat the market.

StockBot is a Python application for designing and testing your own daily stock trading algorithms. Installation Use the

Ryan Cullen 280 Dec 19, 2022
Keir&'s Visualizing Data on Life Expectancy

Keir's Visualizing Data on Life Expectancy Below is information on life expectancy in the United States from 1900-2017. You will also find information

9 Jun 06, 2022
A curated list of awesome Dash (plotly) resources

Awesome Dash A curated list of awesome Dash (plotly) resources Dash is a productive Python framework for building web applications. Written on top of

Luke Singham 1.7k Dec 26, 2022
A simple Monte Carlo simulation using Python and matplotlib library

Monte Carlo python simulation Install linux dependencies sudo apt update sudo apt install build-essential \ software-properties-commo

Samuel Terra 2 Dec 13, 2021
visualize_ML is a python package made to visualize some of the steps involved while dealing with a Machine Learning problem

visualize_ML visualize_ML is a python package made to visualize some of the steps involved while dealing with a Machine Learning problem. It is build

Ayush Singh 164 Dec 12, 2022
A napari plugin for visualising and interacting with electron cryotomograms.

napari-tomoslice A napari plugin for visualising and interacting with electron cryotomograms. Installation You can install napari-tomoslice via pip: p

3 Jan 03, 2023
A simple agent-based model used to teach the basics of OOP in my lectures

Pydemic A simple agent-based model of a pandemic. This is used to teach basic principles of object-oriented programming to master students. It is not

Fabien Maussion 2 Jun 08, 2022
🗾 Streamlit Component for rendering kepler.gl maps

streamlit-keplergl 🗾 Streamlit Component for rendering kepler.gl maps in a streamlit app. 🎈 Live Demo 🎈 Installation pip install streamlit-keplergl

Christoph Rieke 39 Dec 14, 2022
Create animated and pretty Pandas Dataframe or Pandas Series

Rich DataFrame Create animated and pretty Pandas Dataframe or Pandas Series, as shown below: Installation pip install rich-dataframe Usage Minimal exa

Khuyen Tran 92 Dec 26, 2022
Automatic data visualization in atom with the nteract data-explorer

Data Explorer Interactively explore your data directly in atom with hydrogen! The nteract data-explorer provides automatic data visualization, so you

Ben Russert 65 Dec 01, 2022
CONTRIBUTIONS ONLY: Voluptuous, despite the name, is a Python data validation library.

CONTRIBUTIONS ONLY What does this mean? I do not have time to fix issues myself. The only way fixes or new features will be added is by people submitt

Alec Thomas 1.8k Dec 31, 2022