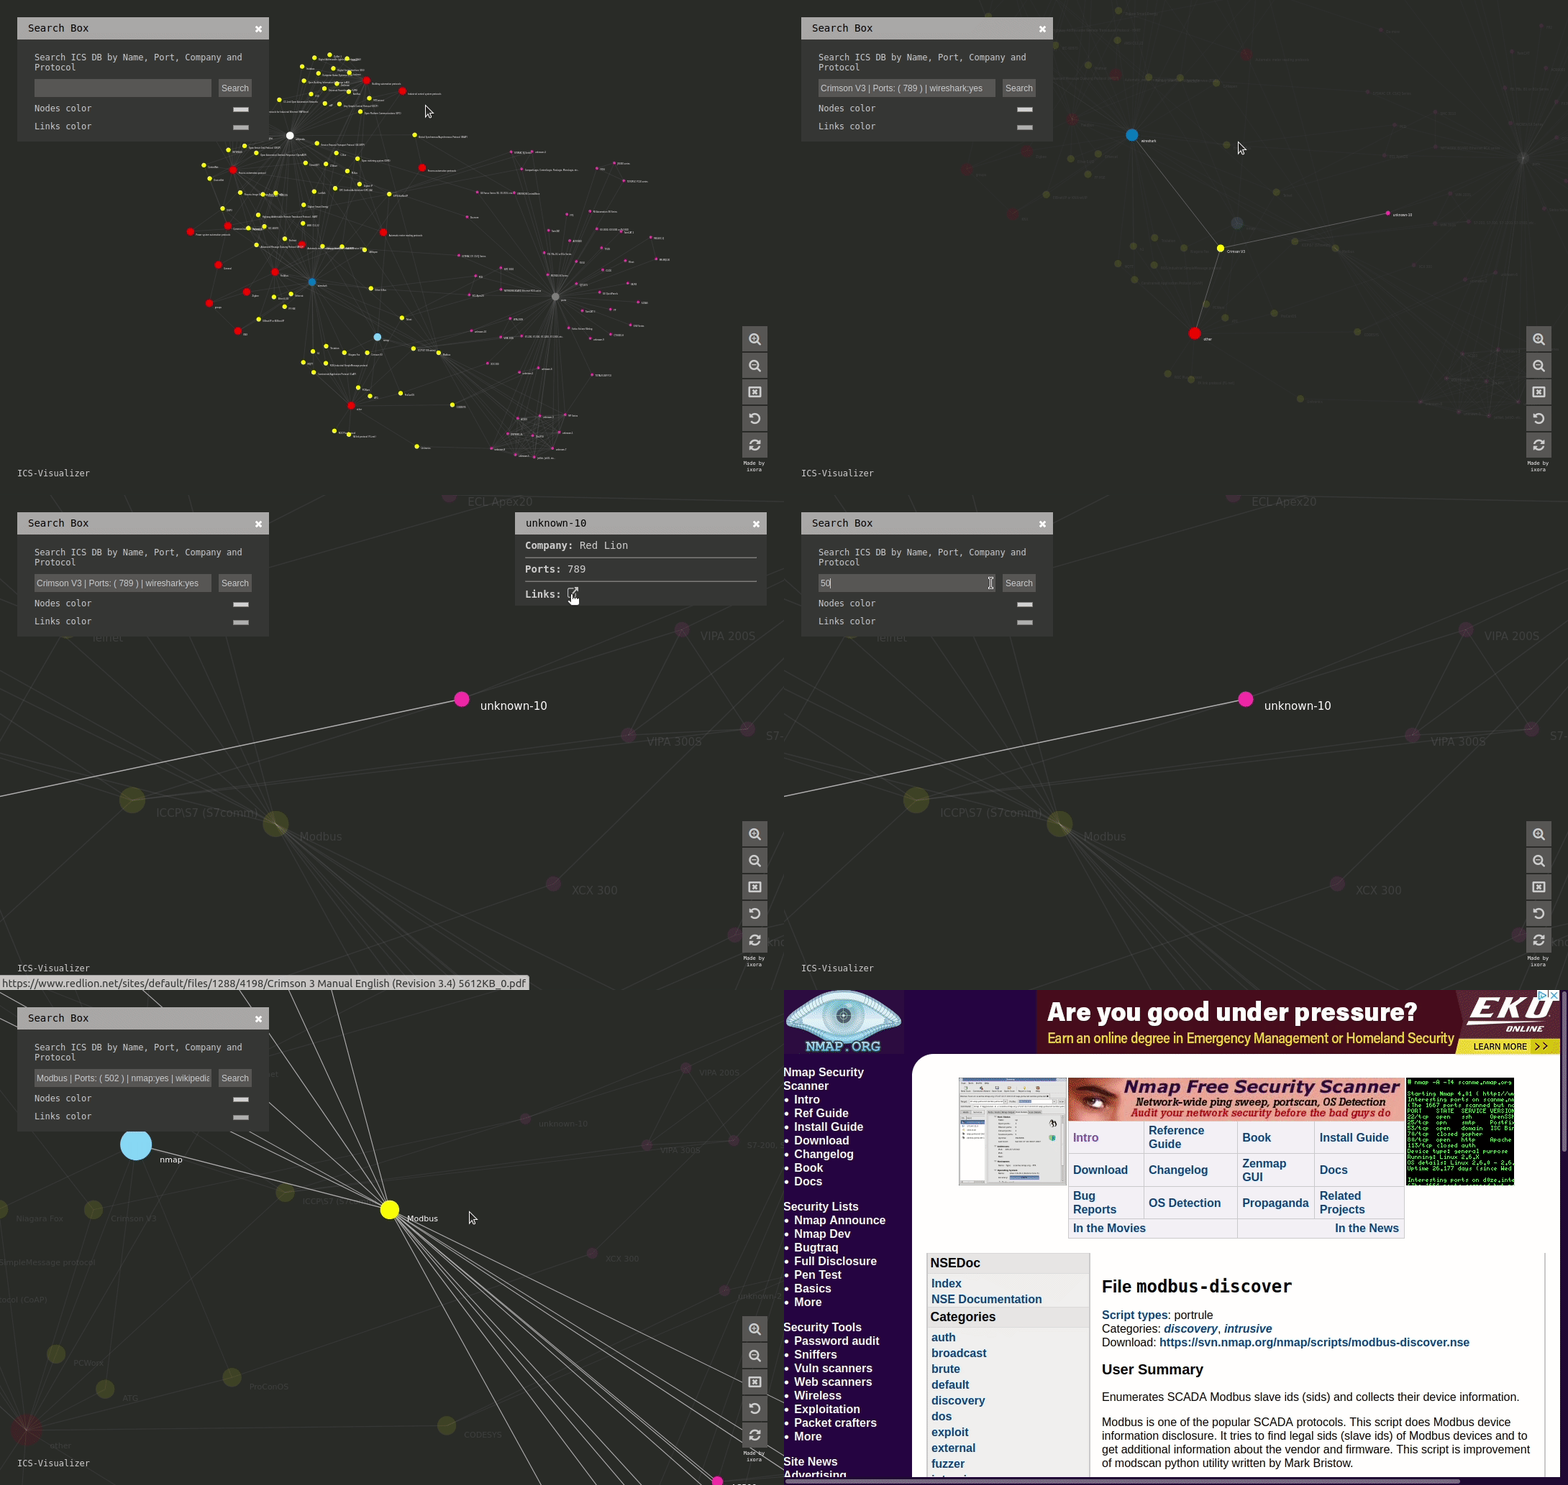
ICS-Visualizer is an interactive Industrial Control Systems (ICS) network graph that contains up-to-date ICS metadata

Overview

Generic badge Generic badge Generic badge Generic badge

ICS-Visualizer is an interactive Industrial Control Systems (ICS) network graph that contains up-to-date ICS metadata (Name, company, port, user manuals, external links, and mapped wireshark\namp modules and scripts).

Interface

Live

https://qeeqbox.github.io/ics-visualizer/

Features

  • ICS metadata (Name, company, port and info)
  • Mapped Wireshark and NMAP modules\scripts
  • External links to great ICS resources (Articles, manuals and projects)
  • Optimized canvas (Fast interaction)
  • Search function (Target item will be highlighted)
  • Zoom-in, zoom-out & reset options

Notes

  • ICS metadata db was compiled using my previous experience with ICS and a lot of great external articles\researches\projects (Do not forget to check them out!)

Resources

d3js.org wikipedia wireshark nmap and more

Other Licenses

By using this framework, you are accepting the license terms of each package listed below: D3, fontawesome, jQuery & JavaScript

Other Projects

Owner
QeeqBox
Security Projects for Red, Blue and Purple Teams
QeeqBox
Visualizations of linear algebra algorithms for people who want a deep understanding

Visualising algorithms on symmetric matrices Examples QR algorithm and LR algorithm Here, we have a GIF animation of an interactive visualisation of t

ogogmad 3 May 05, 2022
Wikipedia WordCloud App generate Wikipedia word cloud art created using python's streamlit, matplotlib, wikipedia and wordcloud packages

Wikipedia WordCloud App Wikipedia WordCloud App generate Wikipedia word cloud art created using python's streamlit, matplotlib, wikipedia and wordclou

Siva Prakash 5 Jan 02, 2022
A Graph Learning library for Humans

A Graph Learning library for Humans These novel algorithms include but are not limited to: A graph construction and graph searching class can be found

Richard Tjörnhammar 1 Feb 08, 2022
Create matplotlib visualizations from the command-line

MatplotCLI Create matplotlib visualizations from the command-line MatplotCLI is a simple utility to quickly create plots from the command-line, levera

Daniel Moura 46 Dec 16, 2022
Automate the case review on legal case documents and find the most critical cases using network analysis

Automation on Legal Court Cases Review This project is to automate the case review on legal case documents and find the most critical cases using netw

Yi Yin 7 Dec 28, 2022
Moscow DEG 2021 elections plots

Построение графиков на основе публичных данных о ДЭГ в Москве в 2021г. Описание Скрипты в данном репозитории позволяют собственноручно построить графи

9 Jul 15, 2022
The repository is my code for various types of data visualization cases based on the Matplotlib library.

ScienceGallery The repository is my code for various types of data visualization cases based on the Matplotlib library. It summarizes the code and cas

Warrick Xu 2 Apr 20, 2022
DataVisualization - The evolution of my arduino and python journey. New level of competence achieved

DataVisualization - The evolution of my arduino and python journey. New level of competence achieved

1 Jan 03, 2022
Python package to Create, Read, Write, Edit, and Visualize GSFLOW models

pygsflow pyGSFLOW is a python package to Create, Read, Write, Edit, and Visualize GSFLOW models API Documentation pyGSFLOW API documentation can be fo

pyGSFLOW 21 Dec 14, 2022
Using SQLite within Python to create database and analyze Starcraft 2 units data (Pandas also used)

SQLite python Starcraft 2 English This project shows the usage of SQLite with python. To create, modify and communicate with the SQLite database from

1 Dec 30, 2021
ICS-Visualizer is an interactive Industrial Control Systems (ICS) network graph that contains up-to-date ICS metadata

ICS-Visualizer is an interactive Industrial Control Systems (ICS) network graph that contains up-to-date ICS metadata (Name, company, port, user manua

QeeqBox 2 Dec 13, 2021
Python support for Godot 🐍🐍🐍

Godot Python, because you want Python on Godot ! The goal of this project is to provide Python language support as a scripting module for the Godot ga

Emmanuel Leblond 1.4k Jan 04, 2023
Simple addon for snapping active object to mesh ground

Snap to Ground Simple addon for snapping active object to mesh ground How to install: install the Python file as an addon use shortcut "D" in 3D view

Iyad Ahmed 12 Nov 07, 2022
Python code for solving 3D structural problems using the finite element method

3DFEM Python 3D finite element code This python code allows for solving 3D structural problems using the finite element method. New features will be a

Rémi Capillon 6 Sep 29, 2022
A D3.js plugin that produces flame graphs from hierarchical data.

d3-flame-graph A D3.js plugin that produces flame graphs from hierarchical data. If you don't know what flame graphs are, check Brendan Gregg's post.

Martin Spier 740 Dec 29, 2022
Attractors is a package for simulation and visualization of strange attractors.

attractors Attractors is a package for simulation and visualization of strange attractors. Installation The simplest way to install the module is via

Vignesh M 45 Jul 31, 2022
Library for exploring and validating machine learning data

TensorFlow Data Validation TensorFlow Data Validation (TFDV) is a library for exploring and validating machine learning data. It is designed to be hig

688 Jan 03, 2023
📊📈 Serves up Pandas dataframes via the Django REST Framework for use in client-side (i.e. d3.js) visualizations and offline analysis (e.g. Excel)

📊📈 Serves up Pandas dataframes via the Django REST Framework for use in client-side (i.e. d3.js) visualizations and offline analysis (e.g. Excel)

wq framework 1.2k Jan 01, 2023
Material for dataviz course at university of Bordeaux

Material for dataviz course at university of Bordeaux

Nicolas P. Rougier 50 Jul 17, 2022
This is a small program that prints a user friendly, visual representation, of your current bsp tree

bspcq, q for query A bspc analyzer (utility for bspwm) This is a small program that prints a user friendly, visual representation, of your current bsp

nedia 9 Apr 24, 2022