International Space Station data with Python research 🌎

Related tags

Data AnalysisISS_data
Overview

espaciador

International Space Station data with Python research 🌎

Plotting ISS trajectory, calculating the velocity over the earth and more.


Plotting trajectory:

We are going to make a graph of the trajectory of the ISS that is N minutes long. The N will be chosen by the user according to their preferences. This means that the program will run and keep points in a list for N minutes.
We will use an API to retrieve ISS current position in latitude and longitude:

http://open-notify.org/Open-Notify-API/ISS-Location-Now/

First we need to import the following python modules:

Pandas to read json data from ISS API, plotly to make the plot of the trajectory and time to time.sleep function
import pandas as pd
import plotly.express as px
import time

Second we must initialize the list that will preserve the latitude and longitude points (every sixty seconds). You also have to initialize the N variable with time in minutes

latitudes = []
longitudes = []
N = 60 # Sixty for one hour trajectory

Then we will create the following for loop to keep recording latitude-longitude points separated by one minute

We use for i in range(N), which is the time that the script will keep running (in hours) because we have a time.sleep(60) at the end
for i in range(N):  
    url = "http://api.open-notify.org/iss-now.json" # API URL

    df = pd.read_json(url) # Pandas read JSON data from API
    
    latitudes.append(df["iss_position"]["latitude"])  # We append latitude ISS position to latitudes list
    longitudes.append(df["iss_position"]["longitude"]) # We append longitude ISS position to longitudes list
    
    time.sleep(60) # This is used to separate de point records with one minute

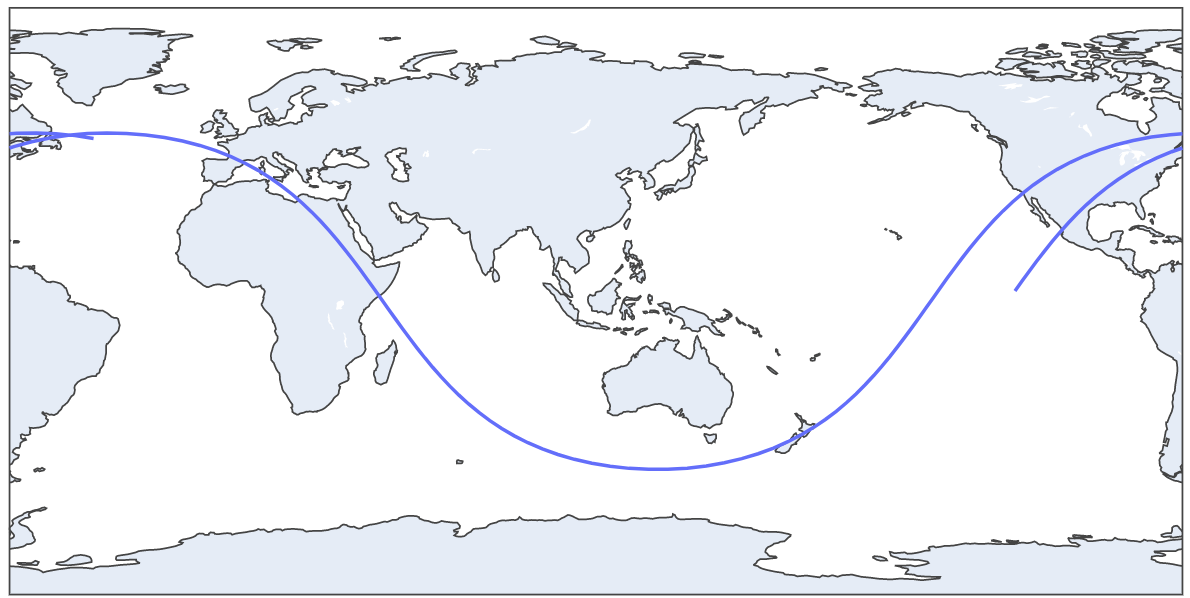
When the for loop finish the iterating we will have a record of N minutes ISS trajectory. Now we can plot this with Plotly (px.line_geo):

px.line_geo will create a plot with earth map
fig = px.line_geo(lat=latitudes, lon=longitudes) # Passing our latitudes and longitudes list as parameter
fig.show()  

image

This is a two hours trajectory plot

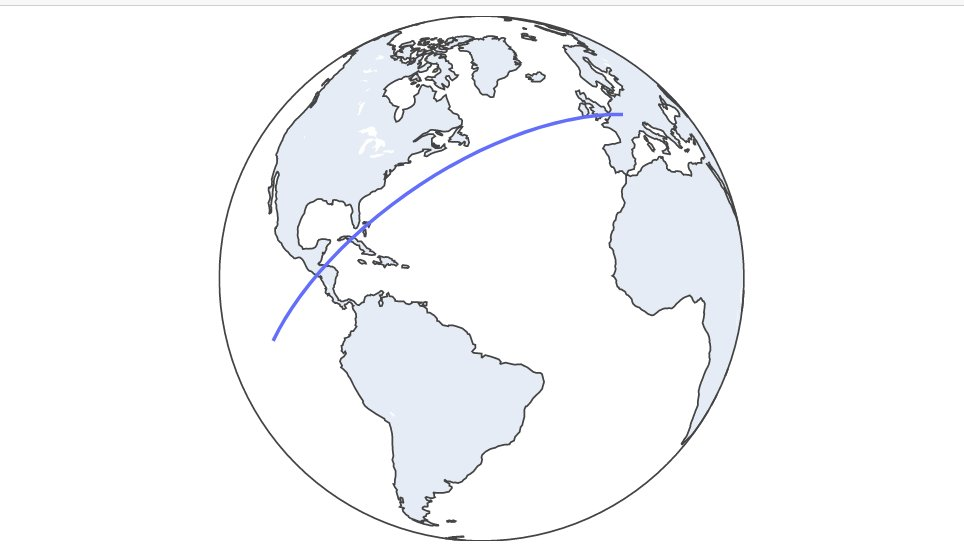
We can update our plot to orthographic projection with this code:

fig.update_geos(projection_type="orthographic")
fig.update_layout(height=300, margin={"r":0,"t":0,"l":0,"b":0})
fig.show()  

image

30 minutes trajectory plot

image

2 Hours trajectory plot GIF

Estimating ISS velocity:

We will estimate the ISS velocity using two diferent latitude-longitude points separated by one minute (sixty seconds). We can get the distance between that two points and then use phisics formula velocity(m/s) = distance(in meters)/time(in seconds)

First import the following python modules

import pandas as pd # Pandas to read API data
import time # Time for time.sleep
import geopy.distance # Geopy to get distance between two lat-lon points
import requests # Get another API data
import json # Read that data
We need to initialize two empty list to save latitudes and longitudes
lat = []
long = []
Next we will use a for loop to get the two latitude-longitude points separated by 60 seconds (time.sleep(60))
for i in range(2):  # for in range(2) because we want two lat-lon points

    url = "http://api.open-notify.org/iss-now.json" # API url

    df = pd.read_json(url) # Read API Json data with Pandas

    lat.append(df["iss_position"]["latitude"]) # Append latitude to lat list
    long.append(df["iss_position"]["longitude"]) # Append longitude to long list

    time.sleep(60) # Wait 60 seconds to record the second lat-lon point
When this for loop finish we will have a lat list with two latitude positions and one long list with two longitude positions. In conjuntion of this 4 numbers we have two lat-lon points in different time moments (separated by one minute)

Then we must get the distance between this points:

We create the two different points. The first one with lat[0] index and long[0]. The second one with lat[1] and long[0]
coords_1 = (lat[0], long[0]) 
coords_2 = (lat[1], long[1])
Then calculate distance with geopy library:
distance = (
geopy.distance.distance(coords_1, coords_2).m
) # Distance between the points in meters
But we must make a litle correction. Because ISS isn't moving in earth surface. It's orbiting aproximately 400Km above earth surface. So the radius is greater. The distance traveled is a litle bit more. To do this, we need to get ISS current altitud. Use the following code:

image

iss_alt_url = "https://api.wheretheiss.at/v1/satellites/25544"
r = requests.get(iss_alt_url)
r = r.text
r = json.loads(r)

iss_alt = int(r["altitude"]) # IN KM
Now apply phisics formula to make the correction
earth_radius = 6371 # in KM
distance_corrected = (distance * (earth_radius+iss_alt)/earth_radius)
Now finish the calculation with speed formula already explained:
speed = distancia_corrected/60 


print(round(speed*3.6, 3), "KM/H") # Multiplied by 3.6 to convert from m/s to km/h. Rounded by 3.

Output:

26367.118 KM/h
Owner
Facundo Pedaccio
Studying computer engineering and economics. I like computer science, physics, astrophysics, rocket science. Or rather the perfect combination of them.
Facundo Pedaccio
MotorcycleParts DataAnalysis python

We work with the accounting department of a company that sells motorcycle parts. The company operates three warehouses in a large metropolitan area.

NASEEM A P 1 Jan 12, 2022
Universal data analysis tools for atmospheric sciences

U_analysis Universal data analysis tools for atmospheric sciences Script written in python 3. This file defines multiple functions that can be used fo

Luis Ackermann 1 Oct 10, 2021
Incubator for useful bioinformatics code, primarily in Python and R

Collection of useful code related to biological analysis. Much of this is discussed with examples at Blue collar bioinformatics. All code, images and

Brad Chapman 560 Jan 03, 2023
Handle, manipulate, and convert data with units in Python

unyt A package for handling numpy arrays with units. Often writing code that deals with data that has units can be confusing. A function might return

The yt project 304 Jan 02, 2023
Calculate multilateral price indices in Python (with Pandas and PySpark).

IndexNumCalc Calculate multilateral price indices using the GEKS-T (CCDI), Time Product Dummy (TPD), Time Dummy Hedonic (TDH), Geary-Khamis (GK) metho

Dr. Usman Kayani 3 Apr 27, 2022
The Master's in Data Science Program run by the Faculty of Mathematics and Information Science

The Master's in Data Science Program run by the Faculty of Mathematics and Information Science is among the first European programs in Data Science and is fully focused on data engineering and data a

Amir Ali 2 Jun 17, 2022
peptides.py is a pure-Python package to compute common descriptors for protein sequences

peptides.py Physicochemical properties and indices for amino-acid sequences. πŸ—ΊοΈ Overview peptides.py is a pure-Python package to compute common descr

Martin Larralde 32 Dec 31, 2022
PipeChain is a utility library for creating functional pipelines.

PipeChain Motivation PipeChain is a utility library for creating functional pipelines. Let's start with a motivating example. We have a list of Austra

Michael Milton 2 Aug 07, 2022
API>local_db>AWS_RDS - Disclaimer! All data used is for educational purposes only.

APIlocal_dbAWS_RDS Disclaimer! All data used is for educational purposes only. ETL pipeline diagram. Aim of project By creating a fully working pipe

0 Apr 25, 2022
Python reader for Linked Data in HDF5 files

Linked Data are becoming more popular for user-created metadata in HDF5 files.

The HDF Group 8 May 17, 2022
Weather analysis with Python, SQLite, SQLAlchemy, and Flask

Surf's Up Weather analysis with Python, SQLite, SQLAlchemy, and Flask Overview The purpose of this analysis was to examine weather trends (precipitati

Art Tucker 1 Sep 05, 2021
songplays datamart provide details about the musical taste of our customers and can help us to improve our recomendation system

Songplays User activity datamart The following document describes the model used to build the songplays datamart table and the respective ETL process.

Leandro Kellermann de Oliveira 1 Jul 13, 2021
A columnar data container that can be compressed.

Unmaintained Package Notice Unfortunately, and due to lack of resources, the Blosc Development Team is unable to maintain this package anymore. During

944 Dec 09, 2022
Leverage Twitter API v2 to analyze tweet metrics such as impressions and profile clicks over time.

Tweetmetric Tweetmetric allows you to track various metrics on your most recent tweets, such as impressions, retweets and clicks on your profile. The

Mathis HAMMEL 29 Oct 18, 2022
Multiple Pairwise Comparisons (Post Hoc) Tests in Python

scikit-posthocs is a Python package that provides post hoc tests for pairwise multiple comparisons that are usually performed in statistical data anal

Maksim Terpilowski 264 Dec 30, 2022
sportsdataverse python package

sportsdataverse-py See CHANGELOG.md for details. The goal of sportsdataverse-py is to provide the community with a python package for working with spo

Saiem Gilani 37 Dec 27, 2022
A Python package for the mathematical modeling of infectious diseases via compartmental models

A Python package for the mathematical modeling of infectious diseases via compartmental models. Originally designed for epidemiologists, epispot can be adapted for almost any type of modeling scenari

epispot 12 Dec 28, 2022
Using Python to derive insights on particular Pokemon, Types, Generations, and Stats

PokΓ©mon Analysis Andreas Nikolaidis February 2022 Introduction Exploratory Analysis Correlations & Descriptive Statistics Principal Component Analysis

Andreas 1 Feb 18, 2022
A data analysis using python and pandas to showcase trends in school performance.

A data analysis using python and pandas to showcase trends in school performance. A data analysis to showcase trends in school performance using Panda

Jimmy Faccioli 0 Sep 07, 2021
Reading streams of Twitter data, save them to Kafka, then process with Kafka Stream API and Spark Streaming

Using Streaming Twitter Data with Kafka and Spark Reading streams of Twitter data, publishing them to Kafka topic, process message using Kafka Stream

Rustam Zokirov 1 Dec 06, 2021