A grammar of graphics for Python

Overview

plotnine

Latest Release release
License license
DOI doi
Build Status buildstatus
Coverage coverage
Documentation documentation

plotnine is an implementation of a grammar of graphics in Python, it is based on ggplot2. The grammar allows users to compose plots by explicitly mapping data to the visual objects that make up the plot.

Plotting with a grammar is powerful, it makes custom (and otherwise complex) plots easy to think about and then create, while the simple plots remain simple.

To find out about all building blocks that you can use to create a plot, check out the documentation. Since plotnine has an API similar to ggplot2, where we lack in coverage the ggplot2 documentation may be of some help.

Example

from plotnine import *
from plotnine.data import mtcars

Building a complex plot piece by piece.

  1. Scatter plot

    (ggplot(mtcars, aes('wt', 'mpg'))
     + geom_point())
    ./doc/images/readme-image-1.png
  2. Scatter plot colored according some variable

    (ggplot(mtcars, aes('wt', 'mpg', color='factor(gear)'))
     + geom_point())
    ./doc/images/readme-image-2.png
  3. Scatter plot colored according some variable and smoothed with a linear model with confidence intervals.

    (ggplot(mtcars, aes('wt', 'mpg', color='factor(gear)'))
     + geom_point()
     + stat_smooth(method='lm'))
    ./doc/images/readme-image-3.png
  4. Scatter plot colored according some variable, smoothed with a linear model with confidence intervals and plotted on separate panels.

    (ggplot(mtcars, aes('wt', 'mpg', color='factor(gear)'))
     + geom_point()
     + stat_smooth(method='lm')
     + facet_wrap('~gear'))
    ./doc/images/readme-image-4.png
  5. Make it playful

    (ggplot(mtcars, aes('wt', 'mpg', color='factor(gear)'))
     + geom_point()
     + stat_smooth(method='lm')
     + facet_wrap('~gear')
     + theme_xkcd())
    ./doc/images/readme-image-5.png

Installation

Official release

# Using pip
$ pip install plotnine         # 1. should be sufficient for most
$ pip install 'plotnine[all]'  # 2. includes extra/optional packages

# Or using conda
$ conda install -c conda-forge plotnine

Development version

$ pip install git+https://github.com/has2k1/plotnine.git

Contributing

Our documentation could use some examples, but we are looking for something a little bit special. We have two criteria:

  1. Simple looking plots that otherwise require a trick or two.
  2. Plots that are part of a data analytic narrative. That is, they provide some form of clarity showing off the geom, stat, ... at their differential best.

If you come up with something that meets those criteria, we would love to see it. See plotnine-examples.

If you discover a bug checkout the issues if it has not been reported, yet please file an issue.

And if you can fix a bug, your contribution is welcome.

Comments
  • Re-license plotnine to the MIT license

    Re-license plotnine to the MIT license

    We are re-licensing plotnine to MIT. It was only licensed as GPL since it was derived from ggplot2 which was GPL at the time, and, now that ggplot2 is MIT, we can relicense plotnine.

    To make this change to plotnine, we need the approval of all copyright holders, which I have found by reviewing contributions from all contributors made after the January 2017 change to GPLv2.

    @akdor1154, @Alyetama, @astrocorgi, @CarlosGrohmann, @ChickenProp, @dulacp, @Fischmiep, @gokceneraslan, @hugovk, @hyiltiz, @JarnoRFB, @jdanbrown, @jeroenjanssens, @joshhartmann11, @jsoma, @jsspencer, @khaeru, @kingishb, @kngwyu, @machow, @stillmatic, @stonebig, @tabedzki, @thomasjpfan, @tr8dr, @TyberiusPrime, @yejianye, would you permit us to re-license plotnine with the MIT license? If so, please comment "I agree" below.

    enhancement 
    opened by has2k1 28
  • Added annotation_logticks

    Added annotation_logticks

    This pull requests adds 'annotation_logticks()' similar to the ggplot2 one: https://ggplot2.tidyverse.org/reference/annotation_logticks.html

    This adds log-10 'log ticks' as an annotation similar to a rug to the plot.

    Looks like this: image

    Example usage:

    import pandas as pd
    import plotnine
    df = pd.DataFrame({"x": [0.1, 0.2, 0.3, 0.4, 0.5, 0.6, 0.7, 0.8, 0.9, 1.0,
                             2, 3, 4, 5]})
    p = plotnine.ggplot(df, plotnine.aes('x','x*3'))
    p += plotnine.geom_point()
    p += plotnine.geom_text(plotnine.aes(label='x'),
                        ha='left', nudge_x=.1)
    p += plotnine.scale_y_log10()
    p += plotnine.scale_x_log10()
    #p += plotnine.geom_rug(sides='lb', width=2, alpha=0.5) #  to check correctness
    p += plotnine.geoms.annotation_logticks(sides='lb', color='red',
                                            alpha=0.8, width=(1.2,.75, 0.4),
                                           linetype='solid')
    
    p
    

    Right now this is not perfect. For one, it's a 'fake geom' that ignores it's data.

    And I've failed to detect when the axis are not log10, and it then will plot misleading tick marks. Can't for the life of me figure out how the geom could detect it though - coord.is_linear is always true.

    So please criticize away.

    opened by TyberiusPrime 23
  • input validation on geom_violin(draw_quantiles)

    input validation on geom_violin(draw_quantiles)

    This PR checks, normalizes and documents the draw_quantiles parameter on geom_violin.

    It now accepts any iterable of floats, or a single float (to be feature compatible with ggplot2). They get converted into a list internally.

    If it's not valid (ie. not float, [float] or values outside of 0..1 (exclusive), a ValueError is raised when calling geom_violin.

    Previously, the following happened:

    • draw_quantiles = True -> Exception in drawing TypeError: object of type 'bool' has no len()
    • draw_quantiles = 0.5 -> Exception in drawing: TypeError: object of type 'float' has no len()
    • draw_quantiles = np.array([0.5]) -> ok
    • draw_quantiles = np.array([0.3, 0.5]) -> exception in drawing: ValueError: The truth value of an array with more than one element is ambiguous. Use a.any() or a.all()
    • draw_quantiles = 0 -> interpreted as False
    • draw_quantiles = [0.0] -> exception in drawing: ValueError: A value in x_new is below the interpolation range.
    • draw_quantiles = [1.0] -> exception in drawing: ValueError: A value in x_new is above the interpolation range.
    • draw_quantiles = [1.25] -> exception in drawing: ValueError: A value in x_new is above the interpolation range.

    These all now either work, or throw a sensible exception ValueError("draw_quantiles must be a float or an iterable of floats (>0.0; < 1.0)") much closer to the actual erroneous call.

    opened by TyberiusPrime 17
  • Use aliased imports in the gallery

    Use aliased imports in the gallery

    I would like to suggest using "import plotnine as p9" (or something like that) in the gallery code instead of "from plotnine import *", and then using "p9" as a prefix for all identifiers defined by plotnine. That would make it much clearer which of them come from plotnine and which don't.

    enhancement 
    opened by jaccovanschaik 16
  • introduced annotation_alternating_backgrounds

    introduced annotation_alternating_backgrounds

    This PR introduces an annotation that adds 'alternating' backgrounds, which is useful to increase readability in tight jitter plots on categorical x-axis data. Example:

    import plotnine as p9
    from plotnine.data import mtcars
    g = p9.ggplot(mtcars.assign(
        gear = pd.Categorical(mtcars.gear),
        am = pd.Categorical(mtcars.am)
    ))
    g += p9.geom_jitter(p9.aes("gear", 'wt', color='am'), width=.45, height=0)
    g += p9.annotation_alternating_background(fills=['grey','darkgrey'],                                         
                                              alpha=.5)
    g += p9.scale_color_manual(['red','blue'])
    

    image

    Supports coord_flip: image

    And more than 2 colors, and does something sensible with non-discrete axis (ie. change shade halfway between labels) image

    opened by TyberiusPrime 15
  • introduced position_adjust_text

    introduced position_adjust_text

    Here's a first implementation of adust_text using a position - see #218 I have extended the position to allow a post-drawing callback, and positions can now define a list of geoms that they work with.

    While this enables the basic use case, there are some kinks we should probably talk with upstream about:

    (p9.ggplot(mtcars, p9.aes('mpg','disp')) + p9.geom_point()
          + p9.geom_text(p9.aes(label='name'), color='blue', position = p9.position_adjust_text(), size=7)
        )
    

    image

    1. Two sets of points and labels don't work well:
    g = (p9.ggplot(mtcars, p9.aes('mpg','disp'))     
         + p9.geom_point()     
          + p9.geom_text(p9.aes(label='name'), color='blue',
                          position = p9.position_adjust_text({
              'arrowprops': {'arrowstyle': '-', 'color': 'blue'}
          }), size=7)
         + p9.geom_point(p9.aes('mpg+1','disp'), color='green')
         + p9.geom_text(p9.aes(x='mpg+1', label='name'), color='green',
                          position = p9.position_adjust_text({
              'arrowprops': {'arrowstyle': '-', 'color': 'green'}
          }), size=7)
        )
    g
    

    image 
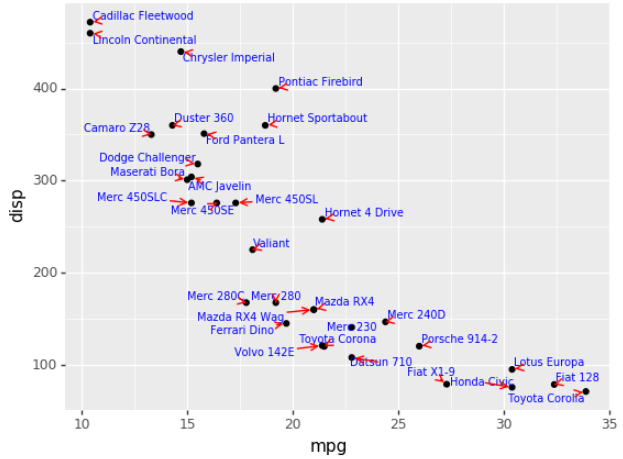
(I think it's an issue with both set's of text labels being drawn on the same ax, and accordingly the second call sees the first set again. Will have to debug.)
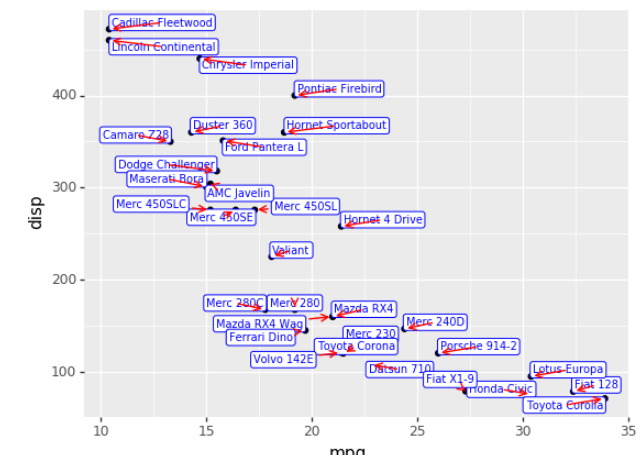
    1. labels and arrows interact badly
    (p9.ggplot(mtcars, p9.aes('mpg','disp')) + p9.geom_point()     
          + p9.geom_label(p9.aes(label='name'), color='blue', position = p9.position_adjust_text(), size=7)
        )
    

    image

    1. no geom_point() -> broken plot
    (p9.ggplot(mtcars, p9.aes('mpg','disp')) 
         # + p9.geom_point()     
          + p9.geom_text(p9.aes(label='name'), color='blue', position = p9.position_adjust_text(), size=7)
        )
    

    image

    3b) geom_point() after geom_text(position_adjust_text) > broken plot

    (p9.ggplot(mtcars, p9.aes('mpg','disp'))      
          + p9.geom_text(p9.aes(label='name'), color='blue', position = p9.position_adjust_text(), size=7)
          + p9.geom_point()     
        )
    

    image

    Also, I note that the adjustment is not fast - it takes a few seconds ever for these 'simple' plots.

    opened by TyberiusPrime 15
  • New matplotlib warnings - when using plotnine 0.4.0

    New matplotlib warnings - when using plotnine 0.4.0

    I am getting some new warnings when using plotnine. My point is - let's make sure, plotnine adapts to the latest matplotlib changes.

    USED VERSIONS & PLATFORMS: OS: Win10 64-bit Anaconda Python: 3.6.6

    matplotlib.version '3.0.0' plotnine.version '0.4.0'

    WARNINGS EXAMPLES: C:\Users\stesim\Anaconda3\envs\py36\lib\site-packages\plotnine\coords\coord_cartesian.py:31: MatplotlibDeprecationWarning: The Bunch class was deprecated in Matplotlib 3.0 and will be removed in 3.2. Use types.SimpleNamespace instead. self.limits = Bunch(xlim=xlim, ylim=ylim)

    C:\Users\stesim\Anaconda3\envs\py36\lib\site-packages\plotnine\facets\layout.py:147: MatplotlibDeprecationWarning: The Bunch class was deprecated in Matplotlib 3.0 and will be removed in 3.2. Use types.SimpleNamespace instead. return Bunch(x=xsc, y=ysc)

    C:\Users\stesim\Anaconda3\envs\py36\lib\site-packages\plotnine\coords\coord.py:144: MatplotlibDeprecationWarning: The Bunch class was deprecated in Matplotlib 3.0 and will be removed in 3.2. Use types.SimpleNamespace instead. y=panel_params['y_range'])

    enhancement invalid 
    opened by stefansimik 14
  • Allow user to change relative width or height of facets

    Allow user to change relative width or height of facets

    This change allows a user of facet_grid() to specify an optional:

    • space={'y': <ratios>}: setting the relative height of vertical facets
      • for example facet_grid("pane ~ .", scales='free_y', space={'y': [2,1,1]}. This would make the top facet height 2x that of the 2nd and 3rd facet
    • space={'x': <ratios>}: setting the relative width of horizontal facets
      • for example space={'x': [1,2,1], ...}
    • or a combination of the two:
      • space={'x': [1,2,1], 'y': [2,1,1]}.

    A similar extension exists for R ggplot(), though not in the main ggplot package. Here is an example:

    import numpy as np
    import pandas as pd
    import plotnine
    from plotnine import *
    
    y = pd.Series(np.random.normal(0.0, 1.0, 400)).cumsum()
    df = y.diff().fillna(0.0)
    x = np.arange(0,400)
    
    gdf = pd.concat([
        pd.DataFrame({'x': x, 'y': y, 'what': 'y', 'pane': 'cumr'}),
        pd.DataFrame({'x': x, 'y': df, 'what': 'df', 'pane': 'df'}),
    ])
    
    (ggplot() +
        geom_line(aes(x='x', y='y', color='what'), data=gdf) +
        facet_grid("pane ~ .", scales="free_y", space={'y': [3,1]}))
    

    See the attached output included. example

    opened by tr8dr 13
  • Plotnine warnings cherry

    Plotnine warnings cherry

    This PR introduces a new Warning class PlotNineWarning, which is now used throughout the plotnine code base when emitting warnings

    It allows the downstream to capture PlotNine warnings in a structured way.

    Note that PlotNine will still emit UserWarnings from upstream - they are not being rewritten.

    I've also promoted PlotNineException and PlotNineWarning to top-level objects on the module, so they're visible to the user.

    opened by TyberiusPrime 13
  • plotnine and pyqt5

    plotnine and pyqt5

    Hello,

    plotnine is a wonderful package. I am trying to figure out how to incorporate plots into a pyqt5 application. For matplotlib, there are a number of examples, but with plotnine, I don't know where to start. Any guidance is greatly appreciated.

    Thank you.

    enhancement question documentation 
    opened by breisfeld 10
  • Possible to hide legend?

    Possible to hide legend?

    R ggplot supports theme(legend.position = "none"), but plotnine doesn't appear to recognize 'none' in theme(legend_position='none').

    • http://ggplot2.tidyverse.org/reference/theme.html

    Is there another way to do this, or is this a feature that would need to be added?

    enhancement 
    opened by jdanbrown 9
  • geom_violin with facet_grid breaks scales=

    geom_violin with facet_grid breaks scales="free"

    I want to plot geom_violins for my data with facet_grid to distinguish variables and I need the scales (at least y) to be free.

    I obtain the following result, notice the same scales for the facets:

    image

    with the following code where I specify scales='free':

    p = (
          ggplot(df)
          + facet_grid("type ~ year", scales="free")
          + geom_violin(aes(x="sdoy", y="data", group="sdoy"))
    )
    

    Also if I replace geom_violin by geom_boxplot it works:

    image

    I can't find were this specificity is mentioned, or is it a bug?

    opened by gigaturbo 0
  • geom_ribbon and geom_smooth problems

    geom_ribbon and geom_smooth problems

    I've previously used geom_ribbon() and geom_smooth() without problems, but now I cannot make my old scripts work. I keep bumping to this:

    2357 2358 """ -> 2360 return masked_where(~(np.isfinite(getdata(a))), a, copy=copy)

    TypeError: ufunc 'isfinite' not supported for the input types, and the inputs could not be safely coerced to any supported types according to the casting rule ''safe''

    All data types are correct and no inf or na values are present.

    upstream-bug critical-bug 
    opened by laurivil 3
  • Feature request: ability to add borders to colorbar

    Feature request: ability to add borders to colorbar

    Discussed in https://github.com/has2k1/plotnine/discussions/652

    Originally posted by AlFontal December 12, 2022 I've been trying to add borders to colorbars to be consistent with other colorbars generated in matplotlib, which by default contain black borders.

    I could always remove the borders on the matplotlib side, but I've come to quite like the aesthetics of a bordered colorbar, and I was wondering whether it's even possible to replicate that.

    As an extra, ggplot2's current release allows to do this by using the frame.colour attribute in guide_colorbar.

    Does anyone know whether there is any way of doing this through the current plotnine API?

    Minimal example of what I mean:

    df = pd.DataFrame({
         'value': np.random.randn(100),
         'variable': np.tile(['A', 'B', 'C', 'D', 'E'], 20),
         'time': np.repeat(np.arange(1, 21), 5)
    })
    
    # in matplotlib
    plt.imshow(df.pivot('time', 'variable', 'value'))
    plt.colorbar()
    
    imagen
    # ggplot2 in R
    ggplot(df) +
        aes(variable, time, fill = value) +
        geom_tile() +
        scale_fill_continuous(type = 'viridis',
                              guide = guide_colorbar(frame.colour = 'black'))
    

    imagen

    feature 
    opened by AlFontal 0
  • geom_text: do not eliminate NaN when format_string or parse is given

    geom_text: do not eliminate NaN when format_string or parse is given

    As string.format happily replaces an NaN with "nan", we forget the information that a value was missing, whereby it is no longer removed by na_rm, but the string "nan" is displayed.

    opened by stettberger 0
  • legend: use figure artist instead of axis artist

    legend: use figure artist instead of axis artist

    When positioning a legend in an faceted plot in an facet != ax[0], the legend is not drawn in front of the facets, but behind them. This behavior is different from ggplot.

    Without the Patch:

    broken

    With the Patch:

    good

    opened by stettberger 2
  • Tests fail with ImportError

    Tests fail with ImportError

    Running tests in the Fedora 36 build environment with Python 3.10.7, pytest-6.2.5, py-1.11.0, pluggy-1.0.0, test_geom_bar_col_histogram.py and test_geom_bin_2d.py fail with:

    ImportError while importing test module '/builddir/build/BUILD/plotnine-0.10.1/tests/test_geom_bar_col_histogram.py'.
    Hint: make sure your test modules/packages have valid Python names.
    Traceback:
    tests/test_geom_bar_col_histogram.py:8: in <module>
        from .conftest import layer_data
    E   ImportError: attempted relative import with no known parent package
    
    ImportError while importing test module '/builddir/build/BUILD/plotnine-0.10.1/tests/test_geom_bin_2d.py'.
    Hint: make sure your test modules/packages have valid Python names.
    Traceback:
    tests/test_geom_bin_2d.py:6: in <module>
        from .conftest import layer_data
    E   ImportError: attempted relative import with no known parent package
    

    I tried working around it by providing an empty init.py in tests/, but that was intercepted by conftest.py itself:

    ../../BUILDROOT/python-plotnine-0.10.1-2.fc36.x86_64/usr/lib/python3.10/site-packages/tests/conftest.py:30: in <module>
        raise OSError(
    E   OSError: The baseline image directory does not exist. This is most likely because the test data is not installed. You may need to install plotnine from source to get the test data.
    

    Running the tests in Fedora 37, which has Python 3.11.0rc2, pytest-7.1.3, pluggy-1.0.0, as is (without empty init.py) works fine.

    wontfix Installation 
    opened by penguinpee 3
Releases(v0.10.1)
  • v0.10.1(Sep 29, 2022)

  • v0.10.0(Sep 29, 2022)

  • v0.9.0(Sep 29, 2022)

  • v0.8.0(Mar 25, 2021)

    API Changes

    • How you map to calculated aesthetics has changed. Use the ~plotnine.aes.after_stat function. The old methods 'stat(name)' and '..name..' have been deprecated.

    New Features

    • You can now map to aesthetics at three different stages. See ~plotnine.aes.aes, ~plotnine.aes.after_stat, ~plotnine.aes.after_scale and ~plotnine.aes.stage.
    • ~plotnine.geoms.geom_violin gained the a new parameter style with which you can draw half violin (density curve on one side and flat on the other).
    • Added ~plotnine.geoms.geom_raster.
    • geoms gained new parameter raster for the ~plotnine.layer.Layer. You can use it to rasterize any layer when the resulting plot is of vector format e.g. pdf.

    Bug Fixes

    • Fixed issue where some plots with a colorbar would fail for specific themes. (424)
    • Fixed ~plotnine.geoms.geom_map to plot MultiLineString geom types.
    • Fixed ~plotnine.geoms.geom_text to allow any order of mapping and data positional arguments.
    • Fixed bug were the plotted image may have ignored theming that relied on some Matplotlib rcParams. (451)
    • Fixed the weight aesthetic in ~plotnine.geoms.geom_boxplot, previously ignored it is now recognised. (438)
    • Fixed ~plotnine.geoms.annotation_logticks and ~plotnine.geoms.annotation_stripes to work without global data and aesthetics. (469)
    • Fix ~plotnine.scales.scale_shape_discrete when print many unfilled shapes not to assign the same shapes to more than one group. (473)
    • Fixed bug in ~plotnine.stats.stat_ellipse where the center of the ellipse assuming a multivariate t-distribution was incorrectly calculated. (493)
    • Fixed calculation of ndensity in ~plotnine.stats.stat_bin. (494)

    Enhancements

    • Manual scales now match the values of the breaks if the breaks are given. (445)

    • Using print to show a ggplot object will not show the hash (<ggplot: ...>) anymore. There is now a difference between repr(p) and str(p). (453)

    • Added option to for the base_family of a theme, now you can set it once with and have it be applied to all themes. (436)

      from plotnine.options import set_option
      set_option('base_family', 'Comic Sans MS')
      
    • You can now add None to a ggplot, doing so returns a copy of the the ggplot object. (474)

    • Better handling of multiline facet labels. (484)

    Source code(tar.gz)
    Source code(zip)
  • v0.7.1(Aug 5, 2020)

    v0.7.1 is a small bugfix and maintenance release. See the official changelog for details. A copy of the changes is also copied below.


    Bug Fixes

    • Fixed issue where a plot has no data and the geoms have no data, but the mappings are valid. (404)
    • Fixed preserve='single' in plotnine.positions.position_dodge and plotnine.positions.position_dodge2 to work for geoms that only have x aesthetic and not xmin and xmax e.g plotnine.geoms.geom_text.
    • Fix regression in v0.7.0 where plots with a colorbar would fail if using ~plotnine.themes.theme_matplotlib.
    Source code(tar.gz)
    Source code(zip)
  • v0.7.0(Jun 5, 2020)

    This is a large release with many bug fixes and enhancements. See offical changelog. A version of the changes is included below.]


    API Changes

    • Changed the default method of caculating bandwidth for all stats that use kernel density estimation. The affected stats are stat_density, stat_ydensity, and stat_sina. These stats can now work with groups that have a single unique value.

    • Changed plotnine.scale.scale_colour_continuous to refer to the same scale as plotnine.scale.scale_color_continuous.

    • Changed plotnine.scale.scale_color_cmap so the parameter cmap_name refers to the name of the color palette and name refers to the name of the scale. (GH371)

    New Features

    • aes got an internal function reorder which makes it easy to change the ordering of a discrete variable according to some other variable/column.

    • stat_smooth can now use formulae for linear models.

    Bug Fixes

    • Fixed issue where a wrong warning could be issued about changing the transform of a specialised scale. It mostly affected the timedelta scale.

    • Fixed plotnine.geoms.geom_violin and other geoms when used with position='dodge' not to crash when if a layer has an empty group of data.

    • Fixed bug in plotnine.geoms.geom_path for some cases when groups had less than 2 points. (GH319)

    • Fixed all stats that compute kernel density estimates to work when all the data points are the same. (GH317)

    • Fixed issue where setting the group to a string value i.e. group='string' outside aes() failed due to an error.

    • Fixed issue where discrete position scales could not deal with fewer limits than those present in the data. (GH342)

    • Fixed issue with using custom tuple linetypes with plotnine.scales.scale_linetype_manual. (GH352)

    • Fixed plotnine.geoms.geom_map to work with facets. (GH359)

    • Fixed plotnine.position.jitter_dodge to work when color is used as an aesthetic. (GH372)

    • Fixed plotnine.geoms.geom_qq to work with facets (GH379)

    • Fixed skewed head in plotnine.geoms.arrow when drawn on facetted plot (GH388)

    • Fixed issue with plotnine.stats.stat_density where weights could not be used with a gaussian model. (GH392)

    • Fixed bug where guide_colorbar width and height could not be controlled by legend_key_width and legend_key_height. (GH360)

    Enhancements

    • You can now set the bandwidth parameter bw of stat_ydensity.

    • Parameters ha and va of geom_text have been converted to aesthetics. You can now map to them. (GH325)

    • All themes (except theme_matplotlib) now do not show minor ticks. (GH348)

    Source code(tar.gz)
    Source code(zip)
  • v0.6.0(Aug 21, 2019)

    This release has many changes, check out the changelog. A version of the changes is included below.


    API Changes

    • The draw parameter of geom_map has been removed. Shapefiles should contain only one type of geometry and that is the geometry that is drawn.

    • Ordinal (Ordered categorical) columns are now mapped to ordinal scales. This creates different plots.

    • The default mapping for the computed aesthetic size of stat_sum has changed to 'stat(n)'. This also changes the default plot for geom_count.

    New Features

    • geom_text gained the adjust_text parameter, and can now repel text.
    • Added annotation_logticks.
    • Added geom_sina
    • Added scales for ordinal (ordered categorical) columns.
    • geom_step gained the option mid for the direction parameter. The steps are taken mid-way between adjacent x values.
    • Added annotation_stripes.

    Bug Fixes

    • Fixed bug where facetting would fail if done on a plot with annotation(s) and one of the facetting columns was also a variable in the environment.

    • Fixed bug where coord_flip would not flip geoms created by geom_rug (GH216).

    • Fixed bug where plots with theme_xkcd cannot be saved twice (GH199)

    • Fixed bug that made it impossible to map to columns with the same name as a calculated columns of the stat. (GH234)

    • Fixed bug in geom_smooth that made it difficult to use it with stats other than stat_smooth. (GH242)

    • Fixed bug in position_dodge where by bar plot could get thinner when facetting and useing preserve = 'single'. (GH224)

    • Fixed bug in coord_trans where if the transformation reversed the original limits, the order in which the data was laid out remained unchanged. (GH253)

    • Fixed bug in stat_count where float weights were rounded and lead to a wrong plot. (GH260)

    • Fixed bug where one could not use the British spelling colour to rename a color scale. (GH264)

    • Fixed bug in lims, xlim, and ylim where datetime and timedelta limits resulted in an error.

    • Fixed bug where geom_rect could not be used with coord_trans. (GH256)

    • Fixed bug where using free scales with facetting and flipping the coordinate axes could give unexpected results. (GH286)

    • Fixed unwanted tick along the axis for versions of Matplotlib >= 3.1.0.

    • Fixed geom_text not to error when using hjust and vjust. (GH287)

    • Fixed bug where geom_abline geom_hline and geom_vline could give wrong results when used with coord_trans.

    • Fixed bug where layers with only infinite values would lead to an exception if they were the first layer encountered when choosing a scale.

    Enhancements

    • Legends are now plotted in a predictable order which dedends on how the plot is constructed.

    • The spokes drawn by geom_spoke can now have a fixed angle.

    • Aesthetics that share a scale (e.g. color and fill can have the same scale) get different guides if mapped to different columns.

    • When the transform of a specialised (one that is not and identity scale) continuous scale is altered, the user is warned about a possible error in what they expect. (GH254, GH255)

    • The method_args parameter in stat_smooth can now differentiate between arguments for initialising and those for fitting the smoothing model.

    • position_nudge can now deal with more geoms e.g. geom_boxplot.

    • The limits parameter of scale_x_discrete and scale_y_discrete can now be a function.

    • The width of the boxplot can now be set irrespective of the stat.

    • The mid-point color of scale_color_distiller now matches that of the trainned data.

    • The way in which layers are created has been refactored to give packages that that extend plotnine more flexibility in manipulating the layers.

    • You can now specify one sided limits for coordinates. e.g. coord_cartesian(limits=(None, 10)).

    • All the themeables have been lifted into the definition of theme so they can be suggested autocomplete.

    Source code(tar.gz)
    Source code(zip)
  • v0.5.1(Oct 17, 2018)

  • v0.5.0(Oct 16, 2018)

    A copy of the changelog is pasted below.


    API Changes

    • Plotnine 0.5.0 only supports Python 3.5 and higher
    • geopandas has been removed as a requirement for installation. Users of geom_map will have to install it separately. (178)

    Bug Fixes

    • Fixed issue where with the subplots_adjust themeable could not be used to set the wspace and hspace Matplotlib subplot parameters. (185)
    • Fixed in stat_bin where setting custom limits for the scale leads to an error. (189)
    • Fixed issue interactive plots where the x & y coordinates of the mouse do not show. (187)
    • Fixed bug in geom_abline where passing the mapping as a keyword parameter lead to a wrong plot. (196)
    • Fixed issue where minor_breaks for tranformed scaled would have to be given in the transformed coordinates. Know they are given the data coordinates just like the major breaks.

    Enhancements

    • For all geoms, with coord_cartesian float('inf') or np.inf are interpreted as the boundary of the plot panel.
    • Discrete scales now show missing data (None and nan). This behaviour is controlled by the new na_translate option.
    • The minor_breaks parameter for continuous scales can now be given as an integer. An integer is taken to controll the number of minor breaks between any set of major breaks.
    Source code(tar.gz)
    Source code(zip)
  • v0.4.0(Aug 1, 2018)

    This is a big release with many improvements and bug-fixes.

    See the official changelog for details.

    Copy of the changelog

    API Changes

    • Calculated aesthetics are accessed using the stat() function. The old method (double dots ..name..) still works.
    • stat_qq calculates slightly different points for the theoretical quantiles.
    • The scales (when set to free, free_x or free_y') parameter of facet_grid and facet_wrap assigns the same scale across the rows and columns.

    New Features

    • Added geom_qq_line and stat_qq_line, for lines through Q-Q plots.
    • Added geom_density_2d and geom_stat_2d.
    • Added stat_ellipse.
    • Added geom_map.
    • Plotnine learned to respect plydata groups.
    • Added stat_hull.
    • Added save_as_pdf_pages().

    Bug Fixes

    • Fixed issue where colorbars may chop off the colors at the limits of a scale.
    • Fixed issue with creating fixed mappings to datetime and timedelta type values.(GH88)
    • Fixed scale_x_datetime and scale_y_datetime to handle the intercepts along the axes (GH97).
    • Fixed stat_bin and stat_bin_2d to properly handle the breaks parameter when used with a transforming scale.
    • Fixed issue with x and y scales where the name of the scale was ignored when determining the axis titles. Now, the name parameter is specified, it is used as the title. (GH105)
    • Fixed bug in discrete scales where a column could not be mapped to integer values. (GH108)
    • Make it possible to hide the legend with theme(legend_position='none'). (GH119)
    • Fixed issue in stat_summary_bin where some input values gave an error. (GH123)
    • Fixed geom_ribbon to sort data before plotting. (GH127)
    • Fixed IndexError in facet_grid when row/column variable has 1 unique value. (GH129)
    • Fixed facet_grid when scale='free', scale='free_x' or scale='free_y', the panels share axes along the row or column.
    • Fixed geom_boxplot so that user can create a boxplot by specifying all required aesthetics. (GH136)
    • Fixed geom_violin to work when some groups are empty. (GH131)
    • Fixed continuous scales to accept minor=None (GH120)
    • Fixed bug for discrete position scales, where drop=False did not drop unused categories (GH139)
    • Fixed bug in stat_ydensity that caused an exception when a panel had no data. (GH147)
    • Fixed bug in coord_trans where coordinate transformation and facetting could fail with a KeyError. (GH151)
    • Fixed bug that lead to a TypeError when aesthetic mappings to could be recognised as being groupable. It was easy to stumble on this bug when using geom_density. (GH165)
    • Fixed bug in facet_wrap where some combination of parameters lead to unexpected panel arrangements. (GH163)
    • Fixed bug where the legend text of colorbars could not be themed. (GH171)
    Source code(tar.gz)
    Source code(zip)
  • v0.3.0(Nov 8, 2017)

    Big release with known bugs fixed and new features.

    A copy of the changelog is pasted below.


    API Changes

    • ~plotnine.geoms.geom_smooth gained an extra parameter legend_fill_ratio that control the area of the legend that is filled to indicate confidence intervals. (32)
    • plotnine.ggplot.save gained an extra parameter verbose. It no longer guesses when to print information and when not to.
    • plotnine.ggplot.draw gained an extra parameter return_ggplot.
    • If the minor_breaks parameter of scales is a callable, it now expects one argument, the limits. Previously it accepted breaks and limits.

    New Features

    • Added ~plotnine.animation.PlotnineAnimation for animations.
    • Added ~plotnine.watermark.watermark for watermarks.
    • Added datetime scales for alpha, colour, fill and size aesthetics

    Enhancements

    • Changed parameter settings for ~plotnine.stats.stat_smooth.

      1. Default span=0.75 instead of 2/3
      2. When using loess smoothing, the control parameter surface is only set to the value 'direct' if predictions will be made outside the data range.
    • Better control of scale limits. You can now specify individual limits of a scale.

      scale_y_continuous(limits=(0, None))
      xlim(None, 100)
      

      You can also use ~plotnine.scales.expand_limits

    • Low and high ~plotnine.scales.scale limits can now be expanded separately with different factors multiplicative and additive factors.

    • The layer parameter show_legend can now accept a dict for finer grained control of which aesthetics to exclude in the legend.

    • Infinite values are removed before statistical computations stats (40).

      stats also gained new parameter na_rm, that controls whether missing values are removed before statistical computations.

    • ~plotnine.qplot can now use the name and a Pandas series to label the scales of the aesthetics.

    • You can now put stuff to add to a ggplot object into a list and add that that instead. No need to wrap the list around the internal class Layers.

      lst = [geom_point(), geom_line()]
      g = ggplot(df, aes('x', 'y'))
      print(g + lst)
      

      Using a list allows you to bundle up objects. It can be convenient when creating some complicated plots. See the Periodic Table Example.

    Bug Fixes

    • Fixed bug where facetting led to a reordering of the data. This would manifest as a bug for geoms where order was important. (26)
    • Fix bug where facetting by a column whose name (eg. class) is a python keyword resulted in an exception. (28)
    • Fix bug where y-axis scaling was calculated from the xlim argument.
    • Fix bug where initialising geoms from stats, and positions from geoms, when passed as classes (e.g. stat_smooth(geom=geom_point), would fail.
    • Fixed bug in plotnine.ggplot.save where s
    Source code(tar.gz)
    Source code(zip)
  • v0.2.0(May 18, 2017)

    Fixes

    • Fixed bug in scale_x_discrete and scale_y_discrete where if they were instantiated with parameter limits that is either a numpy array or a pandas series, plotting would fail with a ValueError.
    • Fixed exceptions when using pandas.pivot_table() for Pandas v0.20.0. The API was fixed.
    • Fixed issues where lines/paths with segments that all belonged in the same group had joins that in some cases were “butted”.

    API Changes

    • geom_text now uses ha and va as parameter names for the horizontal and vertical alignment. This is what matplotlib users expect. The previous names hjust and vjust are silently accepted.
    • Layers() can now be used to bundle up geoms and stats. This makes it easy to reuse geoms and stats or organise them in sensible bundles when making complex plots.
    Source code(tar.gz)
    Source code(zip)
  • v0.1.0(Apr 28, 2017)

A TileDB backend for xarray.

TileDB-xarray This library provides a backend engine to xarray using the TileDB Storage Engine. Example usage: import xarray as xr dataset = xr.open_d

TileDB, Inc. 14 Jun 02, 2021
:art: Diagram as Code for prototyping cloud system architectures

Diagrams Diagram as Code. Diagrams lets you draw the cloud system architecture in Python code. It was born for prototyping a new system architecture d

MinJae Kwon 27.5k Dec 30, 2022
Some useful extensions for Matplotlib.

mplx Some useful extensions for Matplotlib. Contour plots for functions with discontinuities plt.contour mplx.contour(max_jump=1.0) Matplotlib has pro

Nico Schlömer 519 Dec 30, 2022
Some examples with MatPlotLib library in Python

MatPlotLib Example Some examples with MatPlotLib library in Python Point: Run files only in project's directory About me Full name: Matin Ardestani Ag

Matin Ardestani 4 Mar 29, 2022
An interactive dashboard for visualisation, integration and classification of data using Active Learning.

AstronomicAL An interactive dashboard for visualisation, integration and classification of data using Active Learning. AstronomicAL is a human-in-the-

45 Nov 28, 2022
A python wrapper for creating and viewing effects for Matt Parker's christmas tree.

Christmas Tree Visualizer A python wrapper for creating and viewing effects for Matt Parker's christmas tree. Displays py or csv effect files and allo

4 Nov 22, 2022
simple tool to paint axis x and y

simple tool to paint axis x and y

G705 1 Oct 21, 2021
Create SVG drawings from vector geodata files (SHP, geojson, etc).

SVGIS Create SVG drawings from vector geodata files (SHP, geojson, etc). SVGIS is great for: creating small multiples, combining lots of datasets in a

Neil Freeman 78 Dec 09, 2022
A simple python script using Numpy and Matplotlib library to plot a Mohr's Circle when given a two-dimensional state of stress.

Mohr's Circle Calculator This is a really small personal project done for Department of Civil Engineering, Delhi Technological University (formerly, D

Agyeya Mishra 0 Jul 17, 2021
The Spectral Diagram (SD) is a new tool for the comparison of time series in the frequency domain

The Spectral Diagram (SD) is a new tool for the comparison of time series in the frequency domain. The SD provides a novel way to display the coherence function, power, amplitude, phase, and skill sc

Mabel 3 Oct 10, 2022
Apache Superset is a Data Visualization and Data Exploration Platform

Apache Superset is a Data Visualization and Data Exploration Platform

The Apache Software Foundation 49.9k Jan 02, 2023
Minimal Ethereum fee data viewer for the terminal, contained in a single python script.

Minimal Ethereum fee data viewer for the terminal, contained in a single python script. Connects to your node and displays some metrics in real-time.

48 Dec 05, 2022
JSNAPY example: Validate NAT policies

JSNAPY example: Validate NAT policies Overview This example will show how to use JSNAPy to make sure the expected NAT policy matches are taking place.

Calvin Remsburg 1 Jan 07, 2022
CompleX Group Interactions (XGI) provides an ecosystem for the analysis and representation of complex systems with group interactions.

XGI CompleX Group Interactions (XGI) is a Python package for the representation, manipulation, and study of the structure, dynamics, and functions of

Complex Group Interactions 67 Dec 28, 2022
matplotlib: plotting with Python

Matplotlib is a comprehensive library for creating static, animated, and interactive visualizations in Python. Check out our home page for more inform

Matplotlib Developers 16.7k Jan 08, 2023
visualize_ML is a python package made to visualize some of the steps involved while dealing with a Machine Learning problem

visualize_ML visualize_ML is a python package made to visualize some of the steps involved while dealing with a Machine Learning problem. It is build

Ayush Singh 164 Dec 12, 2022
It's an application to calculate I from v and r. It can also plot a graph between V vs I.

Ohm-s-Law-Visualizer It's an application to calculate I from v and r using Ohm's Law. It can also plot a graph between V vs I. Story I'm doing my Unde

Sihab Sahariar 1 Nov 20, 2021
A dashboard built using Plotly-Dash for interactive visualization of Dex-connected individuals across the country.

Dashboard For The DexConnect Platform of Dexterity Global Working prototype submission for internship at Dexterity Global Group. Dashboard for real ti

Yashasvi Misra 2 Jun 15, 2021
Geocoding library for Python.

geopy geopy is a Python client for several popular geocoding web services. geopy makes it easy for Python developers to locate the coordinates of addr

geopy 3.8k Jan 02, 2023