Create 3d loss surface visualizations, with optimizer path. Issues welcome!

Overview

MLVTK PyPI - Python Version PyPI

A loss surface visualization tool

Png

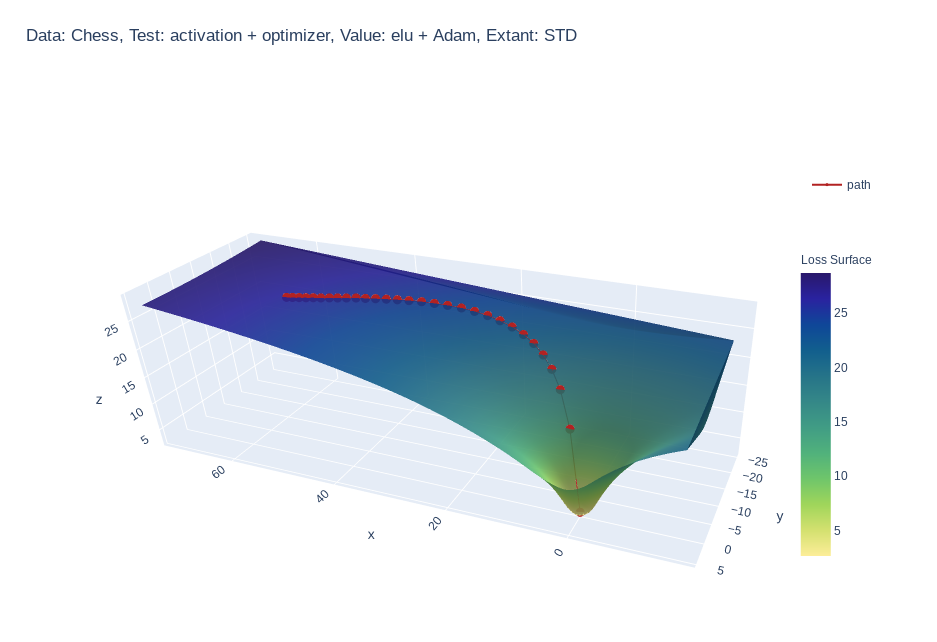
Simple feed-forward network trained on chess data, using elu activation and Adam optimizer


Gif

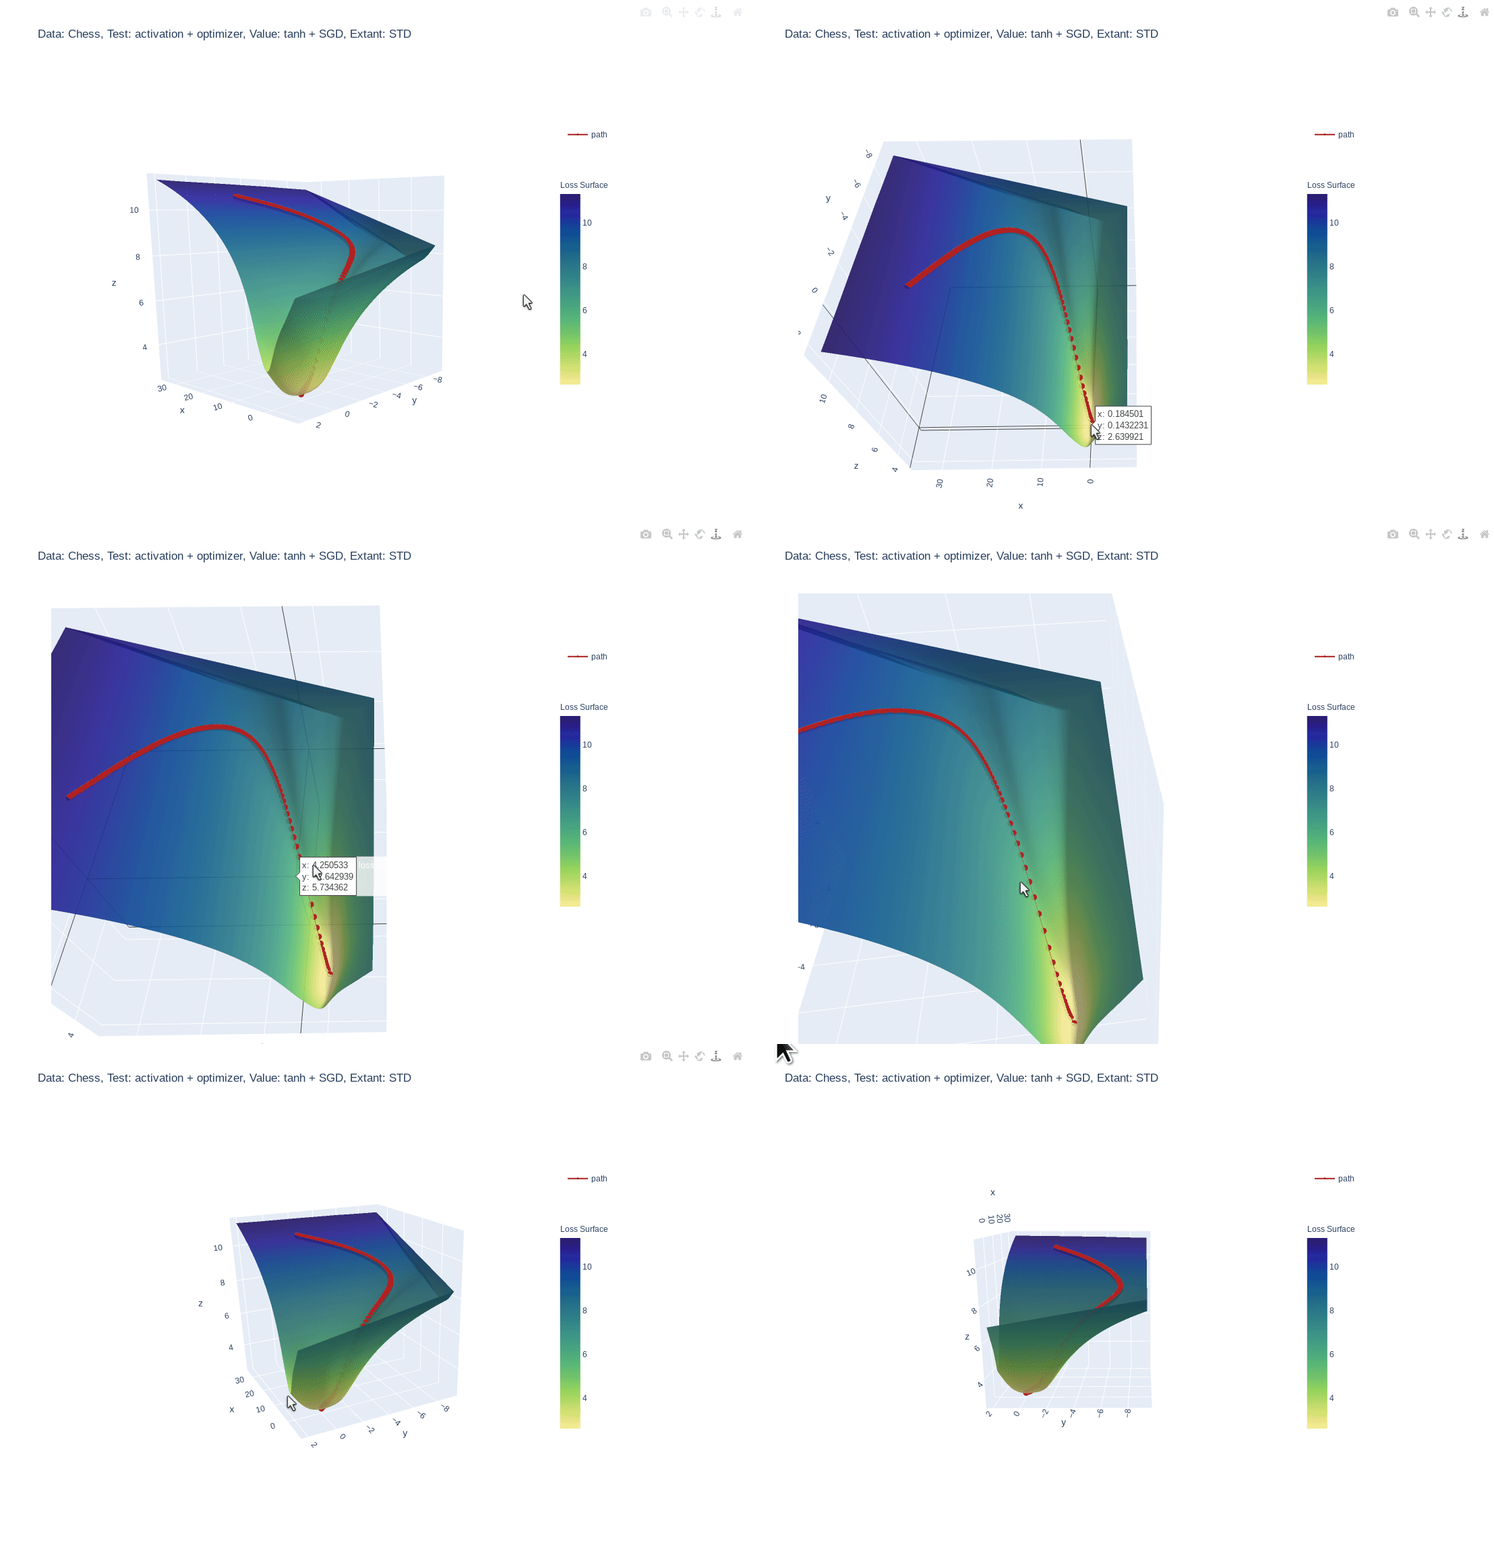
Simple feed-forward network trained on chess data, using tanh activation and SGD optimizer


Gif

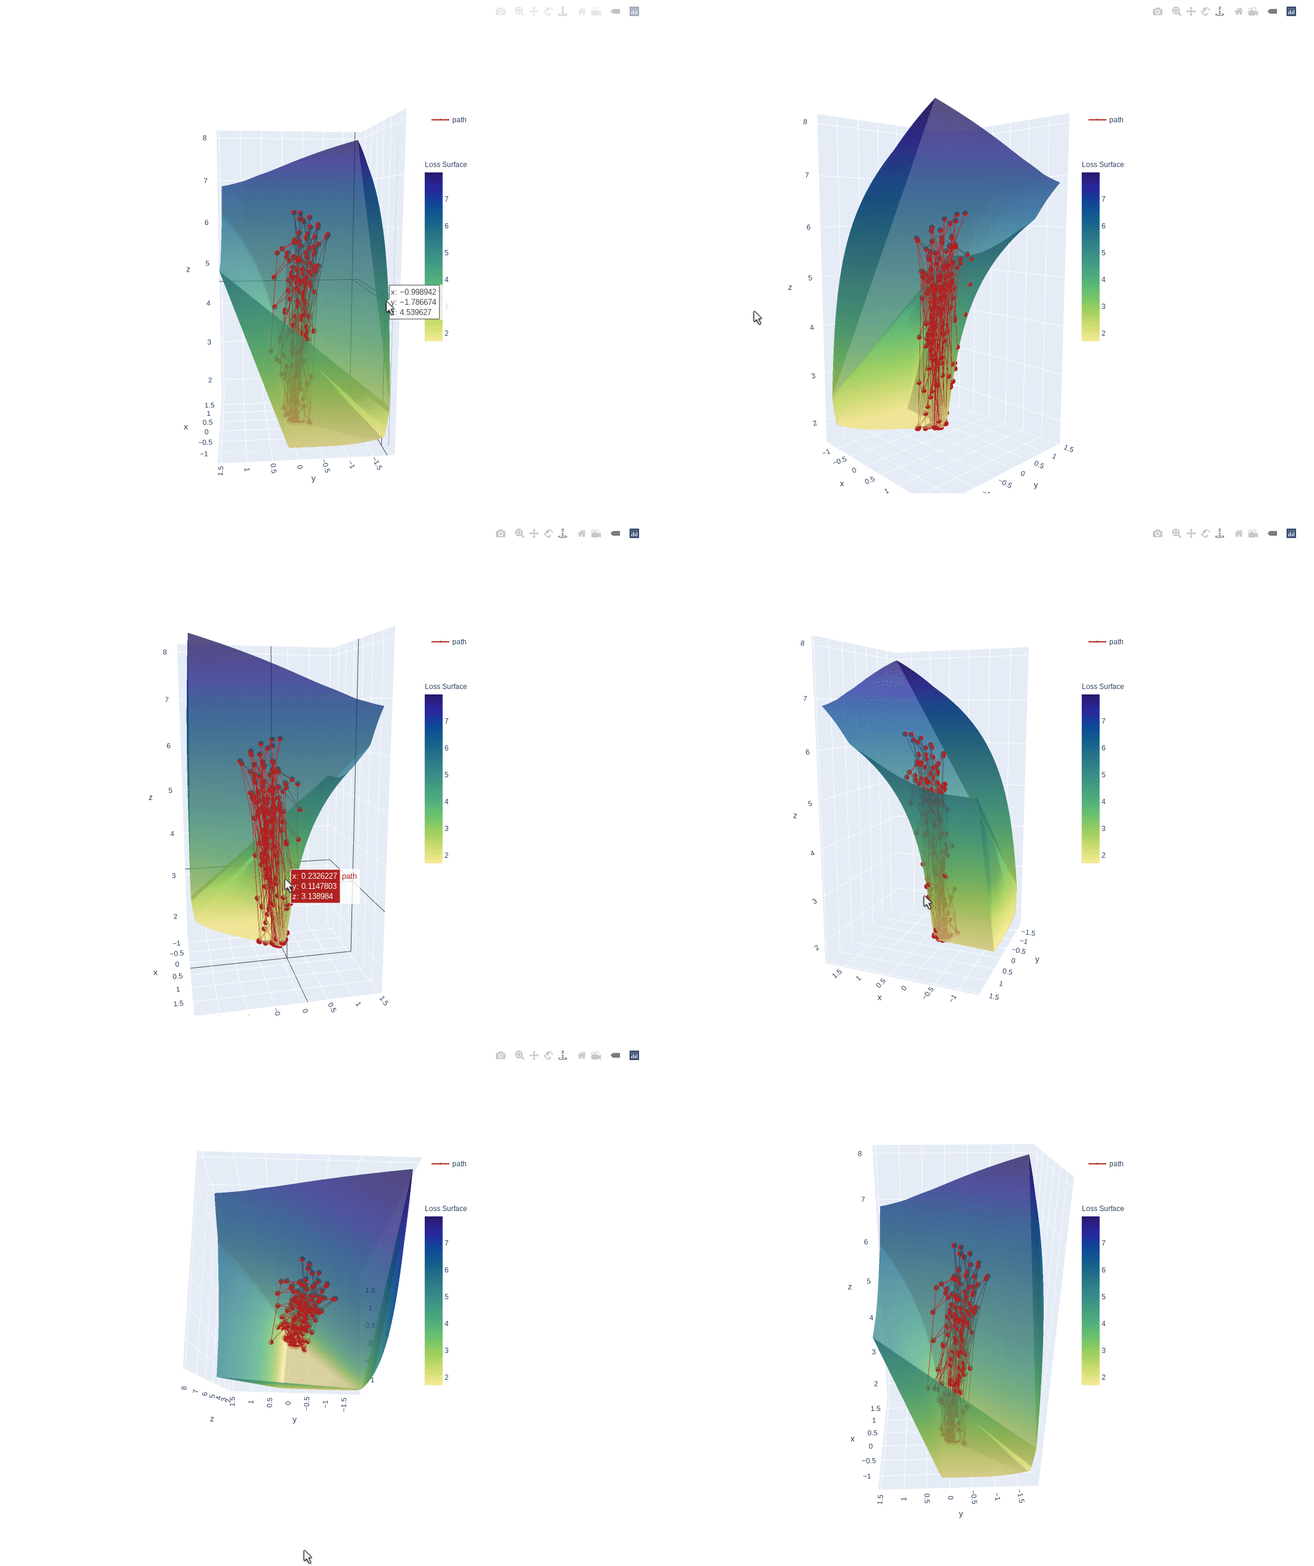
3 layer feed-forward network trained on hand written letters data, using relu activation, SGD optimizer and learning rate of 2.0. Example of what happens to path when learning rate is too high


Gif

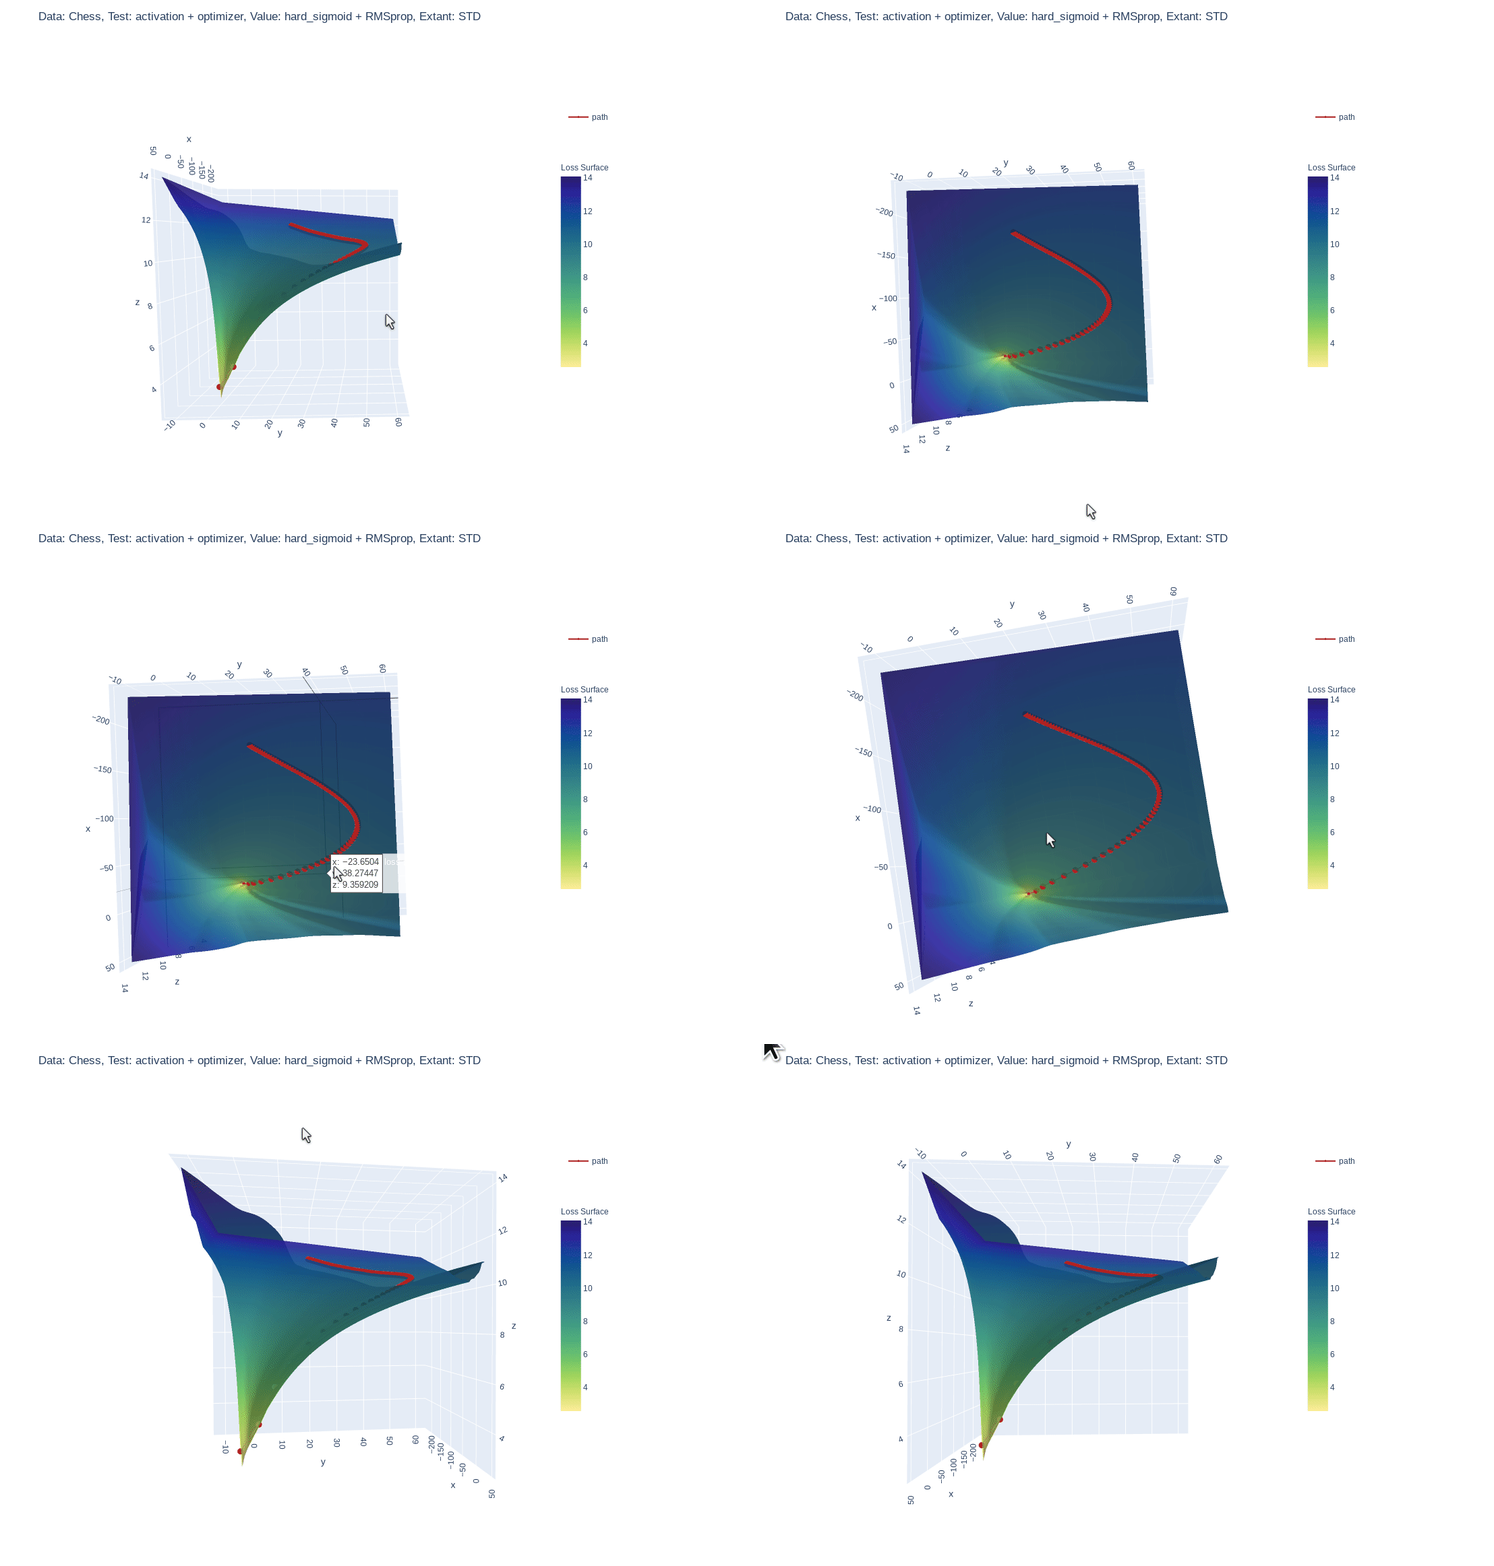
Simple feed-forward network trained on chess data, using hard-sigmoid activation and RMSprop optimizer

Why?

  • :shipit: Simple: A single line addition is all that is needed.
  • Informative: Gain insight into what your model is seeing.
  • 📓 Educational: See how your hyper parameters and architecture impact your models perception.

Quick Start

Requires version
python >= 3.6.1
tensorflow >= 2.3.1
plotly >=4.9.0

Install locally (Also works in google Colab!):

pip install mlvtk

Optionally for use with jupyter notebook/lab:

Notebook

=5.3" "ipywidgets==7.5"">
pip install "notebook>=5.3" "ipywidgets==7.5"

Lab

pip install jupyterlab "ipywidgets==7.5"

# Basic JupyterLab renderer support
jupyter labextension install [email protected]

# OPTIONAL: Jupyter widgets extension for FigureWidget support
jupyter labextension install @jupyter-widgets/jupyterlab-manager [email protected]

Basic Example

from mlvtk.base import Vmodel
import tensorflow as tf
import numpy as np

# NN with 1 hidden layer
inputs = tf.keras.layers.Input(shape=(None,100))
dense_1 = tf.keras.layers.Dense(50, activation='relu')(inputs)
outputs = tf.keras.layers.Dense(10, activation='softmax')(dense_1)
_model = tf.keras.Model(inputs, outputs)

# Wrap with Vmodel
model = Vmodel(_model)
model.compile(optimizer=tf.keras.optimizers.SGD(),
loss=tf.keras.losses.CategoricalCrossentropy(), metrics=['accuracy'])

# All tf.keras.(Model/Sequential/Functional) methods/properties are accessible
# from Vmodel

model.summary()
model.get_config()
model.get_weights()
model.layers

# Create random example data
x = np.random.rand(3, 10, 100)
y = np.random.randint(9, size=(3, 10, 10))
xval = np.random.rand(1, 10, 100)
yval = np.random.randint(9, size=(1,10,10))

# Only difference, model.fit requires validation_data (tf.data.Dataset, or
# other container
history = model.fit(x, y, validation_data=(xval, yval), epochs=10, verbose=0)

# Calling model.surface_plot() returns a plotly.graph_objs.Figure
# model.surface_plot() will attempt to display the figure inline

fig = model.surface_plot()

# fig can save an interactive plot to an html file,
fig.write_html("surface_plot.html")

# or display the plot in jupyter notebook/lab or other compatible tool.
fig.show()
Owner
Research analyst
Python & Julia port of codes in excellent R books

X4DS This repo is a collection of Python & Julia port of codes in the following excellent R books: An Introduction to Statistical Learning (ISLR) Stat

Gitony 5 Jun 21, 2022
Tandem Mass Spectrum Prediction with Graph Transformers

MassFormer This is the original implementation of MassFormer, a graph transformer for small molecule MS/MS prediction. Check out the preprint on arxiv

Röst Lab 13 Oct 27, 2022
GDSHelpers is an open-source package for automatized pattern generation for nano-structuring.

GDSHelpers GDSHelpers in an open-source package for automatized pattern generation for nano-structuring. It allows exporting the pattern in the GDSII-

Helge Gehring 76 Dec 16, 2022
Visualize tensors in a plain Python REPL using Sparklines

Visualize tensors in a plain Python REPL using Sparklines

Shawn Presser 43 Sep 03, 2022
Wikipedia WordCloud App generate Wikipedia word cloud art created using python's streamlit, matplotlib, wikipedia and wordcloud packages

Wikipedia WordCloud App Wikipedia WordCloud App generate Wikipedia word cloud art created using python's streamlit, matplotlib, wikipedia and wordclou

Siva Prakash 5 Jan 02, 2022
Datapane is the easiest way to create data science reports from Python.

Datapane Teams | Documentation | API Docs | Changelog | Twitter | Blog Share interactive plots and data in 3 lines of Python. Datapane is a Python lib

Datapane 744 Jan 06, 2023
Geocoding library for Python.

geopy geopy is a Python client for several popular geocoding web services. geopy makes it easy for Python developers to locate the coordinates of addr

geopy 3.8k Jan 02, 2023
Graphical display tools, to help students debug their class implementations in the Carcassonne family of projects

carcassonne_tools Graphical display tools, to help students debug their class implementations in the Carcassonne family of projects NOTE NOTE NOTE The

1 Nov 08, 2021
Graphing communities on Twitch.tv in a visually intuitive way

VisualizingTwitchCommunities This project maps communities of streamers on Twitch.tv based on shared viewership. The data is collected from the Twitch

Kiran Gershenfeld 312 Jan 07, 2023
Extensible, parallel implementations of t-SNE

openTSNE openTSNE is a modular Python implementation of t-Distributed Stochasitc Neighbor Embedding (t-SNE) [1], a popular dimensionality-reduction al

Pavlin Poličar 1.1k Jan 03, 2023
ecoglib: visualization and statistics for high density microecog signals

ecoglib: visualization and statistics for high density microecog signals This library contains high-level analysis tools for "topos" and "chronos" asp

1 Nov 17, 2021
LinkedIn connections analyzer

LinkedIn Connections Analyzer 🔗 https://linkedin-analzyer.herokuapp.com Hey hey 👋 , welcome to my LinkedIn connections analyzer. I recently found ou

Okkar Min 5 Sep 13, 2022
Political elections, appointment, analysis and visualization in Python

Political elections, appointment, analysis and visualization in Python poli-sci-kit is a Python package for political science appointment and election

Andrew Tavis McAllister 9 Dec 01, 2022
University of Missouri - Kansas City: CS451R: Capstone

CS451RC University of Missouri - Kansas City: CS451R: Capstone Installation cd git clone https://github.com/ala2q6/CS451RC.git cd CS451RC pip3 instal

Alex Arbuckle 1 Nov 17, 2021
Plot and save the ground truth and predicted results of human 3.6 M and CMU mocap dataset.

Visualization-of-Human3.6M-Dataset Plot and save the ground truth and predicted results of human 3.6 M and CMU mocap dataset. human-motion-prediction

Gaurav Kumar Yadav 5 Nov 18, 2022
100 Days of Code The Complete Python Pro Bootcamp for 2022

100-Day-With-Python 100 Days of Code - The Complete Python Pro Bootcamp for 2022. In this course, I spend with python language over 100 days, and I up

Rajdip Das 8 Jun 22, 2022
Simple and fast histogramming in Python accelerated with OpenMP.

pygram11 Simple and fast histogramming in Python accelerated with OpenMP with help from pybind11. pygram11 provides functions for very fast histogram

Doug Davis 28 Dec 14, 2022
Streamlit-template - A streamlit app template based on streamlit-option-menu

streamlit-template A streamlit app template for geospatial applications based on

Qiusheng Wu 41 Dec 10, 2022
Visualise Ansible execution time across playbooks, tasks, and hosts.

ansible-trace Visualise where time is spent in your Ansible playbooks: what tasks, and what hosts, so you can find where to optimise and decrease play

Mark Hansen 81 Dec 15, 2022
mysql relation charts

sqlcharts 自动生成数据库关联关系图 复制settings.py.example 重命名为settings.py 将数据库配置信息填入settings.DATABASE,目前支持mysql和postgresql 执行 python build.py -b,-b是读取数据库表结构,如果只更新匹

6 Aug 22, 2022