Graphing communities on Twitch.tv in a visually intuitive way

Overview

VisualizingTwitchCommunities

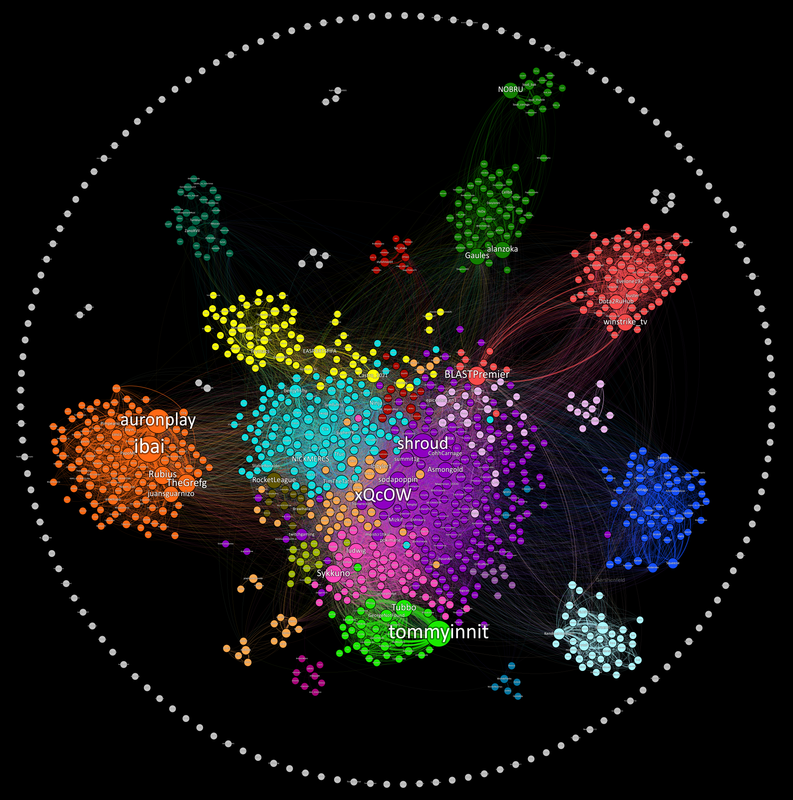
This project maps communities of streamers on Twitch.tv based on shared viewership. The data is collected from the Twitch API and visualized in Gephi.

Results

Twitch-Communities-High-Res.png

I wrote an article on TowardsDataScience here

If your curious about how to read this graph and why I made it, check out the article.

How can I mess with the graph?

I made the graph in a free data visualization tool called Gephi. Download it here The data set is in Visulization/GephiData . In gephi go to laboratory and import the edge file as an edgelist. Then import the label file as a node list. From there you can go to overview and run a modularity analysis on the nodes to detect communities.

How can I collect more data?

The DataCollection folder has a script called main that can be ran to collect the top 100 streams and all their viewers and save it to a csv. You can use the windows task scheduler to run this task at any time interval you like and build up data over long periods of time.
Owner
Kiran Gershenfeld
Making Lives Easier With Computers
Kiran Gershenfeld
Interactive Dashboard for Visualizing OSM Data Change

Dashboard and intuitive data downloader for more interactive experience with interpreting osm change data.

1 Feb 20, 2022
coordinate to draw the nimbus logo on the graffitiwall

This is a community effort to draw the nimbus logo on beaconcha.in's graffitiwall. get started clone repo with git clone https://github.com/tennisbowl

4 Apr 04, 2022
Squidpy is a tool for the analysis and visualization of spatial molecular data.

Squidpy is a tool for the analysis and visualization of spatial molecular data. It builds on top of scanpy and anndata, from which it inherits modularity and scalability. It provides analysis tools t

Theis Lab 251 Dec 19, 2022
Compute and visualise incidence (reworking of the original incidence package)

incidence2 incidence2 is an R package that implements functions and classes to compute, handle and visualise incidence from linelist data. It refocuss

15 Nov 22, 2022
🐞 📊 Ladybug extension to generate 2D charts

ladybug-charts Ladybug extension to generate 2D charts. Installation pip install ladybug-charts QuickStart import ladybug_charts API Documentation Loc

Ladybug Tools 3 Dec 30, 2022
ecoglib: visualization and statistics for high density microecog signals

ecoglib: visualization and statistics for high density microecog signals This library contains high-level analysis tools for "topos" and "chronos" asp

1 Nov 17, 2021
GDSHelpers is an open-source package for automatized pattern generation for nano-structuring.

GDSHelpers GDSHelpers in an open-source package for automatized pattern generation for nano-structuring. It allows exporting the pattern in the GDSII-

Helge Gehring 76 Dec 16, 2022
Runtime analysis of code with plotting

Runtime analysis of code with plotting A quick comparison among Python, Cython, and the C languages A Programming Assignment regarding the Programming

Cena Ashoori 2 Dec 24, 2021
📊 Extensions for Matplotlib

📊 Extensions for Matplotlib

Nico Schlömer 519 Dec 30, 2022
metedraw is a project mainly for data visualization projects of Atmospheric Science, Marine Science, Environmental Science or other majors

It is mainly for data visualization projects of Atmospheric Science, Marine Science, Environmental Science or other majors.

Nephele 11 Jul 05, 2022
Python implementation of the Density Line Chart by Moritz & Fisher.

PyDLC - Density Line Charts with Python Python implementation of the Density Line Chart (Moritz & Fisher, 2018) to visualize large collections of time

Charles L. Bérubé 10 Jan 06, 2023
Some useful extensions for Matplotlib.

mplx Some useful extensions for Matplotlib. Contour plots for functions with discontinuities plt.contour mplx.contour(max_jump=1.0) Matplotlib has pro

Nico Schlömer 519 Dec 30, 2022
NorthPitch is a python soccer plotting library that sits on top of Matplotlib

NorthPitch is a python soccer plotting library that sits on top of Matplotlib.

Devin Pleuler 30 Feb 22, 2022
A python script editor for napari based on PyQode.

napari-script-editor A python script editor for napari based on PyQode. This napari plugin was generated with Cookiecutter using with @napari's cookie

Robert Haase 9 Sep 20, 2022
PolytopeSampler is a Matlab implementation of constrained Riemannian Hamiltonian Monte Carlo for sampling from high dimensional disributions on polytopes

PolytopeSampler PolytopeSampler is a Matlab implementation of constrained Riemannian Hamiltonian Monte Carlo for sampling from high dimensional disrib

9 Sep 26, 2022
Simple, realtime visualization of neural network training performance.

pastalog Simple, realtime visualization server for training neural networks. Use with Lasagne, Keras, Tensorflow, Torch, Theano, and basically everyth

Rewon Child 416 Dec 29, 2022
A way of looking at COVID-19 data that I haven't seen before.

Visualizing Omicron: COVID-19 Deaths vs. Cases Click here for other countries. Data is from Our World in Data/Johns Hopkins University. About this pro

1 Jan 10, 2022
These data visualizations were created as homework for my CS40 class. I hope you enjoy!

Data Visualizations These data visualizations were created as homework for my CS40 class. I hope you enjoy! Nobel Laureates by their Country of Birth

9 Sep 02, 2022
An interactive GUI for WhiteboxTools in a Jupyter-based environment

whiteboxgui An interactive GUI for WhiteboxTools in a Jupyter-based environment GitHub repo: https://github.com/giswqs/whiteboxgui Documentation: http

Qiusheng Wu 105 Dec 15, 2022
GitHub English Top Charts

Help you discover excellent English projects and get rid of the interference of other spoken language.

kon9chunkit 529 Jan 02, 2023