The Metabolomics Integrator (MINT) is a post-processing tool for liquid chromatography-mass spectrometry (LCMS) based metabolomics.

Overview

CII Best Practices Github All Releases

MINT (Metabolomics Integrator)

The Metabolomics Integrator (MINT) is a post-processing tool for liquid chromatography-mass spectrometry (LCMS) based metabolomics. Metabolomics is the study of all metabolites (small chemical compounds) in a biological sample e.g. from bacteria or a human blood sample. The metabolites can be used to define biomarkers used in medicine to find treatments for diseases or for the development of diagnostic tests or for the identification of pathogens such as methicillin resistant Staphylococcus aureus (MRSA). More information on how to install and run the program can be found in the Documentation or check out the Quickstart to jump right into it.

Browser based as standalone application or server based

A demo server is available here. Be mindful, you share the server with others.

Metabolomics with Python

MINT originally started as Python project. The core of MINT is a Python class for targeted metabolomics that can be used independent of the graphical application.

from ms_mint.notebook import Mint
mint.ms_files = glob('/path/to/files/*mzML')
mint.peaklist_files = '/path/to/peaklist/file/peaklist.csv'
mint.run()
mint.results

Mint Jupyter Results

Contributions are welcome

MINT integrates open-source software and packages into a Python library for metabolomics with a browser based GUI. It is programmed by scientists for scientists to contribute to better and faster science integrating best practices of data management and computer science. Contributions are welcome that improve the efficiency of the code, bug fixes, feature implementations, security enhancements among others. If you want to contribute to MINT please send me a notification.

How to contribute

Errors, Feedback, Feature Requests

If you encounter an error, if you have a request for a new feature, or for general feedback, please open a new ticket at the issue tracker.

Code contributions

If your are up to enhance the codebase yourself, we ask you to followowing steps:

  1. fork the repository
  2. implement the new feature or bug-fix
  3. add corresponding tests
  4. run flake8
  5. submit a pull request

Code standards

Before submitting a pull request please run flake8.

Get in touch

Open an issue or join the slack channel.

Acknowledgements

This project would not be possible without the help of the open-source community. The tools and resources provided by GitHub, Docker-Hub, the Python Package Index, as well the answers from dedicated users on Stackoverflow and the Plotly community, as well as the free open-source packages used are the foundation of this project. Several people have made direct contributions to the codebase and we are extremely grateful for that.

  • @rokm refactored the specfile for Pyinstaller to create a windows package.
  • @bucknerns helped with the configuration of the versioneer file.

Last but not least, we want to thank all the users and early adopters that drive the development with feature requests and bug reports.

You might also like...
Simple spectra visualization tool for astronomers

SpecViewer A simple visualization tool for astronomers. Dependencies Python = 3.7.4 PyQt5 = 5.15.4 pyqtgraph == 0.10.0 numpy = 1.19.4 How to use py

A visualization tool made in Pygame for various pathfinding algorithms.

Pathfinding-Visualizer 🚀 A visualization tool made in Pygame for various pathfinding algorithms. Pathfinding is closely related to the shortest path

A command line tool for visualizing CSV/spreadsheet-like data

PerfPlotter Read data from CSV files using pandas and generate interactive plots using bokeh, which can then be embedded into HTML pages and served by

simple tool to paint axis x and y

simple tool to paint axis x and y

A System Metrics Monitoring Tool Built using Python3 , rabbitmq,Grafana and InfluxDB. Setup using docker compose. Use to monitor system performance with graphical interface of grafana , storage of influxdb and message queuing of rabbitmq Bioinformatics tool for exploring RNA-Protein interactions
Bioinformatics tool for exploring RNA-Protein interactions

Explore RNA-Protein interactions. RNPFind is a bioinformatics tool. It takes an RNA transcript as input and gives a list of RNA binding protein (RBP)

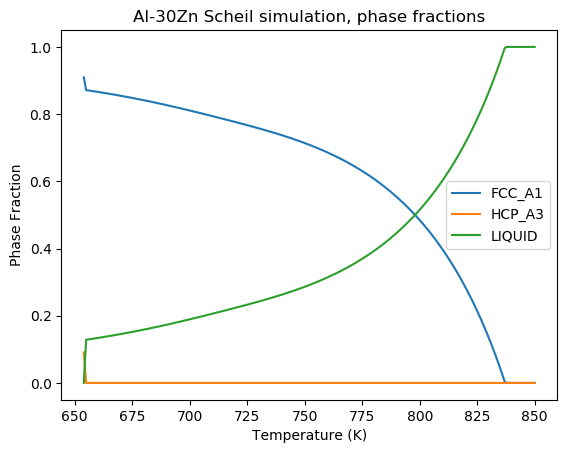
A Scheil-Gulliver simulation tool using pycalphad.

scheil A Scheil-Gulliver simulation tool using pycalphad. import matplotlib.pyplot as plt from pycalphad import Database, variables as v from scheil i

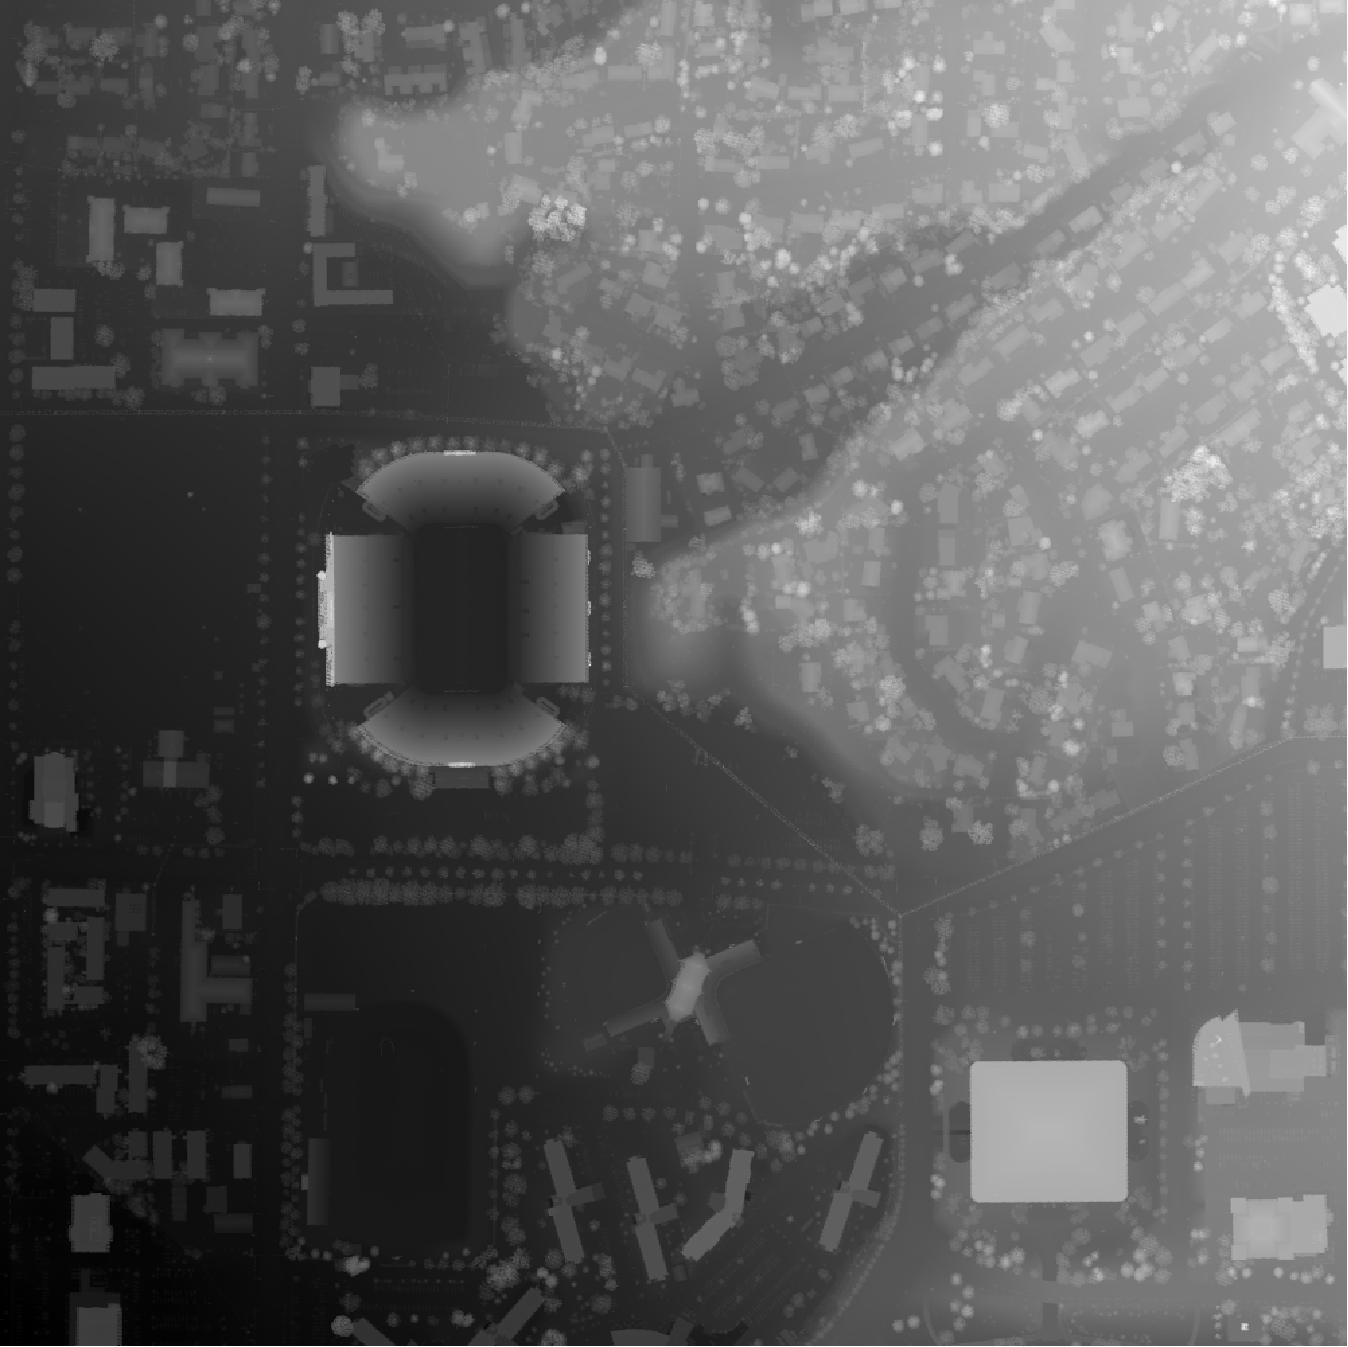
A tool for automatically generating 3D printable STLs from freely available lidar scan data.

mini-map-maker A tool for automatically generating 3D printable STLs from freely available lidar scan data. Screenshots Tutorial To use this script, g

The Spectral Diagram (SD) is a new tool for the comparison of time series in the frequency domain

The Spectral Diagram (SD) is a new tool for the comparison of time series in the frequency domain. The SD provides a novel way to display the coherence function, power, amplitude, phase, and skill score of discrete frequencies of two time series. Each SD summarises these quantities in a single plot for multiple targeted frequencies.

Comments
  • error

    error

    Hello, first of all congratulations for the application. I tried to run the application but got an error. First of all, the application is constantly updating itself in the part with dash. Secondly, when it comes to the upload data part, the following calback error appears.

    Callback error updating {"index": "ms-uploader-output", "type": "output"}, "children" TypeError: expected str, bytes or os.PathLike object, not list fn_new = P(ms_dir) / P(fn).name I couldn't run it, it seems to load the data, but it doesn't, giving these errors.

    (I guess P(fn).name doesn't see it as path.)

    opened by hilaluzunoglu 0
Releases(0.0.56)
Owner
Sören Wacker
Research Associate in the Lewis Research Group at the University of Calgary.
Sören Wacker
Visualize data of Vietnam's regions with interactive maps.

Plotting Vietnam Development Map This is my personal project that I use plotly to analyse and visualize data of Vietnam's regions with interactive map

1 Jun 26, 2022
Machine learning beginner to Kaggle competitor in 30 days. Non-coders welcome. The program starts Monday, August 2, and lasts four weeks. It's designed for people who want to learn machine learning.

30-Days-of-ML-Kaggle 🔥 About the Hands On Program 💻 Machine learning beginner → Kaggle competitor in 30 days. Non-coders welcome The program starts

Roja Achary 145 Jan 01, 2023
DrawBot lets you draw images taken from the internet on Skribbl.io, Gartic Phone and Paint

DrawBot You don't speak french? No worries, english translation is over here. C'est quoi ? DrawBot est un logiciel codé par V2F qui va prendre possess

V2F 205 Jan 01, 2023
Dipto Chakrabarty 7 Sep 06, 2022
Data parsing and validation using Python type hints

pydantic Data validation and settings management using Python type hinting. Fast and extensible, pydantic plays nicely with your linters/IDE/brain. De

Samuel Colvin 12.1k Jan 06, 2023
A tool for creating SVG timelines from simple JSON input.

A tool for creating SVG timelines from simple JSON input.

Jason Reisman 432 Dec 30, 2022
Data aggregated from the reports found at the MCPS COVID Dashboard into a set of visualizations.

Montgomery County Public Schools COVID-19 Visualizer Contents About this project Data Support this project About this project Data All data we use can

James 3 Jan 19, 2022
Python support for Godot 🐍🐍🐍

Godot Python, because you want Python on Godot ! The goal of this project is to provide Python language support as a scripting module for the Godot ga

Emmanuel Leblond 1.4k Jan 04, 2023
These data visualizations were created for my introductory computer science course using Python

Homework 2: Matplotlib and Data Visualization Overview These data visualizations were created for my introductory computer science course using Python

Sophia Huang 12 Oct 20, 2022
Simple spectra visualization tool for astronomers

SpecViewer A simple visualization tool for astronomers. Dependencies Python = 3.7.4 PyQt5 = 5.15.4 pyqtgraph == 0.10.0 numpy = 1.19.4 How to use py

5 Oct 07, 2021
Because trello only have payed options to generate a RunUp chart, this solves that!

Trello Runup Chart Generator The basic concept of the project is that Corello is pay-to-use and want to use Trello To-Do/Doing/Done automation with gi

Rômulo Schiavon 1 Dec 21, 2021
HiPlot makes understanding high dimensional data easy

HiPlot - High dimensional Interactive Plotting HiPlot is a lightweight interactive visualization tool to help AI researchers discover correlations and

Facebook Research 2.4k Jan 04, 2023
Create matplotlib visualizations from the command-line

MatplotCLI Create matplotlib visualizations from the command-line MatplotCLI is a simple utility to quickly create plots from the command-line, levera

Daniel Moura 46 Dec 16, 2022
A high performance implementation of HDBSCAN clustering. http://hdbscan.readthedocs.io/en/latest/

HDBSCAN Now a part of scikit-learn-contrib HDBSCAN - Hierarchical Density-Based Spatial Clustering of Applications with Noise. Performs DBSCAN over va

Leland McInnes 91 Dec 29, 2022
finds grocery stores and stuff next to route (gpx)

Route-Report Route report is a command-line utility that can be used to locate points-of-interest near your planned route (gpx). The results are based

Clemens Mosig 5 Oct 10, 2022
Bokeh Plotting Backend for Pandas and GeoPandas

Pandas-Bokeh provides a Bokeh plotting backend for Pandas, GeoPandas and Pyspark DataFrames, similar to the already existing Visualization feature of

Patrik Hlobil 822 Jan 07, 2023
Matplotlib colormaps from the yt project !

cmyt Matplotlib colormaps from the yt project ! Colormaps overview The following colormaps, as well as their respective reversed (*_r) versions are av

The yt project 5 Sep 16, 2022
Make sankey, alluvial and sankey bump plots in ggplot

The goal of ggsankey is to make beautiful sankey, alluvial and sankey bump plots in ggplot2

David Sjoberg 156 Jan 03, 2023
Simple implementation of Self Organizing Maps (SOMs) with rectangular and hexagonal grid topologies

py-self-organizing-map Simple implementation of Self Organizing Maps (SOMs) with rectangular and hexagonal grid topologies. A SOM is a simple unsuperv

Jonas Grebe 1 Feb 10, 2022
基于python爬虫爬取COVID-19爆发开始至今全球疫情数据并利用Echarts对数据进行分析与多样化展示。

COVID-19-Epidemic-Map 基于python爬虫爬取COVID-19爆发开始至今全球疫情数据并利用Echarts对数据进行分析与多样化展示。 觉得项目还不错的话欢迎给一个star! 项目的源码可以正常运行,各个库的版本、数据库的建表语句、运行过程中遇到的坑以及解决方式在笔记.md中都

31 Dec 15, 2022