A tool for automatically generating 3D printable STLs from freely available lidar scan data.

Overview

mini-map-maker

A tool for automatically generating 3D printable STLs from freely available lidar scan data.

Screenshots

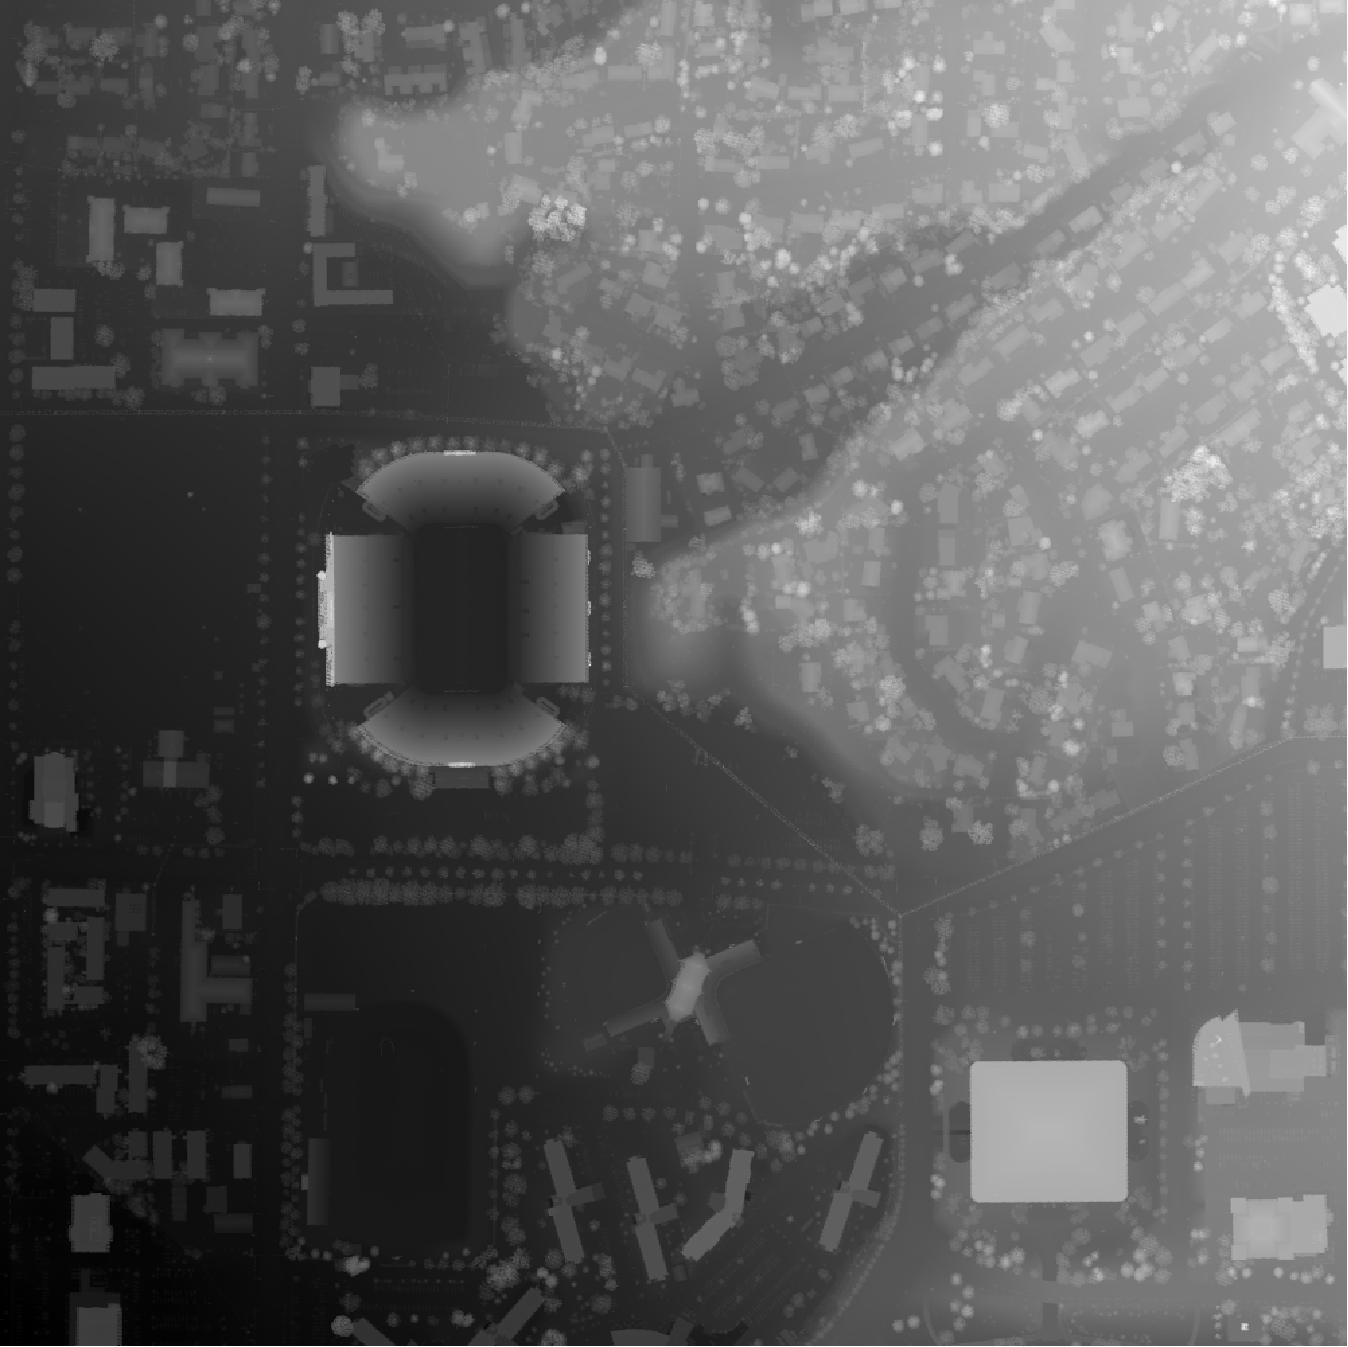
image image

Tutorial

To use this script, go to the USGS LidarExplorer

https://prd-tnm.s3.amazonaws.com/LidarExplorer/index.html#/

Select an area, and then click the "Download list" button under "Lidar within AOI" image This should give you a file called downloadlist.txt. Simply place this text file in the same directory as the script, and then run the script (convert.py, or convert.exe if you don't want to deal with Python). By default, mini-map-maker will generate an STL file for each tile in the lidar data. However, there are quite a few command line arguments that you can use to customize the output.

>convert.py -h

usage: convert [-h] [--input INPUT] [--reduce REDUCE] [--vscale VSCALE]
               [--base BASE] [--merge] [--no_stl] [--cleanup] [--filter FILTER] [--prj]

A utility for automatically generating 3D printable STLs from USGS lidar scans.

optional arguments:
  -h, --help            show this help message and exit
  
  --input INPUT, -i INPUT
                        The name of the file containing the URLs of all of the lidar scan data.
                        
  --reduce REDUCE, -r REDUCE
                        A decimal value that will decrease the output file size as it increases.
                        The default value is 1.0
                        
  --vscale VSCALE, -v VSCALE
                        A decimal value that will make artificially make things taller as it increases.
                        The default value is 1.0
                        
  --base BASE, -b BASE  A decimal value that sets the base height of the model. The default value is 0.0
  
  --merge, -m           Using this flag will merge all of the point clouds into one file before converting into a DEM.
  
  --no_stl, -s          Using this flag will disable STL generation.
  
  --cleanup, -c         Using this flag will cause the program to automatically delete the unzipped point cloud files
                        after running.
                        
  --filter FILTER, -f FILTER
                        A percent value (0-100, for the slope of the points being smoothed) that will enable the spike
                        smoothing option. This is good if you have points that are floating way up above the model and
                        causing spikes in your final model.
                        
  --prj, -p             Using this flag will cause the program to automatically download and use lastools to generate
                        projection files for the elevation models. This is important if you want to generate the STLs
                        yourself in QGIS, but it means you'll have to be mindful of lastool's license limitations.
                        More info on lastool's website (https://rapidlasso.com/lastools/).
                        
  --external_files, -e  Using this flag will grab las/laz files from the LAS directory instead of downloading them from
                        an input list.

Additional Examples:

External Files

Let's say you already have some las files you want to use. Simply place them into a directory called LAS, and then call the script from from the directory containing the LAS folder, using the --external_files flag, like so:

convert.py --external_files

This trick also works with LAZ files, or even a mix of LAZ and LAS files.

Adding a Base and Manipulating the Output

For one project, I had a LAZ file that had a section of ocean. This caused the output to be super flat, and too thin in several places to print well. Additionally, it was a pretty high resolution file, so the output STL was very large, and I wasn't happy with the vertical scale of the file either. So, after placing my LAZ file into a directory labeled LAS like mentioned above, I used the following command:

convert.py --external_files --filter 50 --base 10 --vscale 0.5 --reduce 2

Filtering got rid of some weird spikes in the output STL, and the base command increased the total height of the output. The vscale command made the model shorter, and reduce significantly decreased the size of the STL.

Support This Project

Like this project? Feel free to make a donation.

ko-fi

Licensing

With the default options, this program is completely open source, and the output is usable in a commercial environment. This code itself is MIT License, as is r-barnes' DEMto3D library that this program makes use of.

https://github.com/r-barnes/DEMto3D

If you want to use the output in QGIS or another GIS program, and enable .prj file generation, then the sript will automatically download lastools. The .prj files generated are free to use if it's not for commercial purposes. If you plan on using the .prj files for commercial purposes, you will need to purchase a lastools license in accordance with the information on lastool's website:

https://rapidlasso.com/lastools/

Additionally, this script makes use of some public domain utilities from FUSION by the US Forest Service

http://forsys.sefs.uw.edu/FUSION/fusion_overview.html

With the addition of LAZ processing, this project now utilizes LASzip, an LGPL-2.1 tool. It is included as a precompiled binary (laszip-cli.exe), and no modifications have been made.
https://github.com/LASzip/LASzip

Owner
Mike Abbott
Mike Abbott
Python package for hypergraph analysis and visualization.

The HyperNetX library provides classes and methods for the analysis and visualization of complex network data. HyperNetX uses data structures designed to represent set systems containing nested data

Pacific Northwest National Laboratory 304 Dec 27, 2022
A python script to visualise explain plans as a graph using graphviz

README Needs to be improved Prerequisites Need to have graphiz installed on the machine. Refer to https://graphviz.readthedocs.io/en/stable/manual.htm

Edward Mallia 1 Sep 28, 2021
Profile and test to gain insights into the performance of your beautiful Python code

Profile and test to gain insights into the performance of your beautiful Python code View Demo - Report Bug - Request Feature QuickPotato in a nutshel

Joey Hendricks 138 Dec 06, 2022
Bioinformatics tool for exploring RNA-Protein interactions

Explore RNA-Protein interactions. RNPFind is a bioinformatics tool. It takes an RNA transcript as input and gives a list of RNA binding protein (RBP)

Nahin Khan 3 Jan 27, 2022
📊📈 Serves up Pandas dataframes via the Django REST Framework for use in client-side (i.e. d3.js) visualizations and offline analysis (e.g. Excel)

📊📈 Serves up Pandas dataframes via the Django REST Framework for use in client-side (i.e. d3.js) visualizations and offline analysis (e.g. Excel)

wq framework 1.2k Jan 01, 2023
Python Data Structures for Humans™.

Schematics Python Data Structures for Humans™. About Project documentation: https://schematics.readthedocs.io/en/latest/ Schematics is a Python librar

Schematics 2.5k Dec 28, 2022
ipyvizzu - Jupyter notebook integration of Vizzu

ipyvizzu - Jupyter notebook integration of Vizzu. Tutorial · Examples · Repository About The Project ipyvizzu is the Jupyter Notebook integration of V

Vizzu 729 Jan 08, 2023
Python implementation of the Density Line Chart by Moritz & Fisher.

PyDLC - Density Line Charts with Python Python implementation of the Density Line Chart (Moritz & Fisher, 2018) to visualize large collections of time

Charles L. Bérubé 10 Jan 06, 2023
基于python爬虫爬取COVID-19爆发开始至今全球疫情数据并利用Echarts对数据进行分析与多样化展示。

COVID-19-Epidemic-Map 基于python爬虫爬取COVID-19爆发开始至今全球疫情数据并利用Echarts对数据进行分析与多样化展示。 觉得项目还不错的话欢迎给一个star! 项目的源码可以正常运行,各个库的版本、数据库的建表语句、运行过程中遇到的坑以及解决方式在笔记.md中都

31 Dec 15, 2022
A way of looking at COVID-19 data that I haven't seen before.

Visualizing Omicron: COVID-19 Deaths vs. Cases Click here for other countries. Data is from Our World in Data/Johns Hopkins University. About this pro

1 Jan 10, 2022
Simulation du problème de Monty Hall avec Python et matplotlib

Le problème de Monty Hall C'est un jeu télévisé où il y a trois portes sur le plateau de jeu. Seule une de ces portes cache un trésor. Il n'y a rien d

ETCHART YANG 1 Jan 06, 2022
Material for dataviz course at university of Bordeaux

Material for dataviz course at university of Bordeaux

Nicolas P. Rougier 50 Jul 17, 2022
A blender import/export system for Defold

defold-blender-export A Blender export system for the Defold game engine. Setup Notes There are no exhaustive documents for this tool yet. Its just no

David Lannan 27 Dec 30, 2022
Visualise top-rated GitHub repositories in a barchart by keyword

This python script was written for simple purpose -- to visualise top-rated GitHub repositories in a barchart by keyword. Script generates html-page with barchart and information about repository own

Cur1iosity 2 Feb 07, 2022
Simple Inkscape Scripting

Simple Inkscape Scripting Description In the Inkscape vector-drawing program, how would you go about drawing 100 diamonds, each with a random color an

Scott Pakin 140 Dec 27, 2022
Create animated and pretty Pandas Dataframe or Pandas Series

Rich DataFrame Create animated and pretty Pandas Dataframe or Pandas Series, as shown below: Installation pip install rich-dataframe Usage Minimal exa

Khuyen Tran 92 Dec 26, 2022
Backend app for visualizing CANedge log files in Grafana (directly from local disk or S3)

CANedge Grafana Backend - Visualize CAN/LIN Data in Dashboards This project enables easy dashboard visualization of log files from the CANedge CAN/LIN

13 Dec 15, 2022
A TileDB backend for xarray.

TileDB-xarray This library provides a backend engine to xarray using the TileDB Storage Engine. Example usage: import xarray as xr dataset = xr.open_d

TileDB, Inc. 14 Jun 02, 2021
`charts.css.py` brings `charts.css` to Python. Online documentation and samples is available at the link below.

charts.css.py charts.css.py provides a python API to convert your 2-dimension data lists into html snippet, which will be rendered into charts by CSS,

Ray Luo 3 Sep 23, 2021
A small script written in Python3 that generates a visual representation of the Mandelbrot set.

Mandelbrot Set Generator A small script written in Python3 that generates a visual representation of the Mandelbrot set. Abstract The colors in the ou

1 Dec 28, 2021