`charts.css.py` brings `charts.css` to Python. Online documentation and samples is available at the link below.

Overview

charts.css.py

charts.css.py provides a python API to convert your 2-dimension data lists into html snippet, which will be rendered into charts by CSS, when serving inside a browser.

  • The output of charts.css.py is not images. Consequently, charts.css.py is a pure Python package without any image library dependency. You can use charts.css.py on any platform.
  • The output of charts.css.py is a normal HTML table. Search engines and screen readers will be able to consume your data even when CSS rendering is unavailable.
  • Once the html snippet is delivered into the browser window, the rendering is done by CSS, which is typically faster than JS-heavy chart libraries.
  • Since the output is normal HTML, you could customize its size and position, by defining your own CSS styles.

Installation

pip install charts.css.py

Usage

Just combine the output of charts.css.py functions and the predefined CSS style <link rel="stylesheet" href="https://cdn.jsdelivr.net/npm/charts.css/dist/charts.min.css"> into your html page.

For example, the following code snippet can convert a 2-dimension list into column chart:

from charts.css import column
STYLESHEET = '<link rel="stylesheet" href="https://cdn.jsdelivr.net/npm/charts.css/dist/charts.min.css">'
chart = column(
    [
        ["Continent", "1st year", "2nd year", "3rd year", "4th year", "5th year"],
        ["Asia", 20.0, 30.0, 40.0, 50.0, 75.0],
        ["Euro", 40.0, 60.0, 75.0, 90.0, 100.0],
    ],
    headers_in_first_row=True,
    headers_in_first_column=True,
    )
# Now, variable chart contains html snippet of "<table>...</table>", and
# STYLESHEET is just a constant string of "<link href='https://.../charts.css'>".
# You can somehow insert them into the proper places of your full html page.
# Here in this sample, we take a shortcut by simply concatenating them.
open("output.html", "w").write(STYLESHEET + chart)

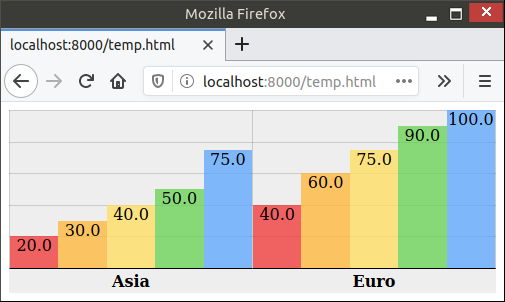
The output.html will be rendered in browser like this:

Sample output

Advanced Usage

There are currently 4 different charts implemented: bar, column, line, area. All those methods support many parameters to further customize the chart appearance. bar() and column() also support stacking by value or stacking by percentage. All those features are demonstrated in the different samples in this document.

Lastly, this package also provides a command-line tool csv2chart. You can use it to convert csv file into an html file. For example, csv2chart sample.csv output.html. You can also run csv2chart -h to know all the parameters it supports.

Versioning

charts.css.py uses Semantic Versioning.
You might also like...
🐞 📊 Ladybug extension to generate 2D charts

ladybug-charts Ladybug extension to generate 2D charts. Installation pip install ladybug-charts QuickStart import ladybug_charts API Documentation Loc

GitHub English Top Charts

Help you discover excellent English projects and get rid of the interference of other spoken language.

Data-FX is an addon for Blender (2.9) that allows for the visualization of data with different charts

Data-FX Data-FX is an addon for Blender (2.9) that allows for the visualization of data with different charts Currently, there are only 2 chart option

Glue is a python project to link visualizations of scientific datasets across many files.

Glue Glue is a python project to link visualizations of scientific datasets across many files. Click on the image for a quick demo: Features Interacti

Flipper Zero documentation repo

Flipper Zero Docs Participation To fix a bug or add something new to this repository, you need to open a pull-request. Also, on every page of the site

A tool for automatically generating 3D printable STLs from freely available lidar scan data.

mini-map-maker A tool for automatically generating 3D printable STLs from freely available lidar scan data. Screenshots Tutorial To use this script, g

A Python Binder that merge 2 files with any extension by creating a new python file and compiling it to exe which runs both payloads.

Update ! ANONFILE MIGHT NOT WORK ! About A Python Binder that merge 2 files with any extension by creating a new python file and compiling it to exe w

Debugging, monitoring and visualization for Python Machine Learning and Data Science

Welcome to TensorWatch TensorWatch is a debugging and visualization tool designed for data science, deep learning and reinforcement learning from Micr

Python module for drawing and rendering beautiful atoms and molecules using Blender.

Batoms is a Python package for editing and rendering atoms and molecules objects using blender. A Python interface that allows for automating workflows.

Comments
  • charts.css.py 0.4.0

    charts.css.py 0.4.0

    This release adds some helper and parameters to help you fine tune the chart appearance. They are especially useful when you attempt to render some csv data input with many rows.

    • Feature: A transpose(...) helper to flip your input data diagonally so that it swaps its x-axis and y-axis.
    • Feature: New parameter hide_label. It is useful when primary axis contains too many rows.
    • Feature: New parameter tooltip_builder which has a shape of lambda value="...", label="...": "...".
    • Feature: New parameter value_converter which typically will be assigned with either int or float.
    • Change: By default, data axes will no longer be shown. You can turn it back on by the new show_data_axes parameter.

    The online documentation will be updated to demonstrate these new features.

    opened by rayluo 0
  • Release 0.3.0

    Release 0.3.0

    • Line chart should not accept non-zero data_spacing or datasets_spacing. Now it would rightfully reject such an input.
    • Provide an online document/sample
    • Backport to Brython 3.7 and 3.8. The recommended Brython version is still its latest version, currently 3.9.
    opened by rayluo 0
  • charts.css.py 0.1.0

    charts.css.py 0.1.0

    The first release contains:

    • Basic functionality including bar, column, line and area
    • An experimental helper wrapper
    • Barely enough documentation in README.md
    • Also comes with a command-line tool csv2chart. I use it for my ad-hoc test. Let me know if you find it useful.
    opened by rayluo 0
Releases(0.4.0)
  • 0.4.0(Jun 27, 2021)

    This release adds some helper and parameters to help you fine tune the chart appearance. They are especially useful when you attempt to render some csv data input with many rows.

    • Feature: A transpose(...) helper to flip your input data diagonally so that it swaps its x-axis and y-axis.
    • Feature: New parameter value_converter which typically will be assigned with either int or float. With its help, now you can consume data directly from csv by data = list(csv.reader(f)).
    • Feature: New parameter hide_label. It is useful when primary axis contains too many rows.
    • Feature: New parameter tooltip_builder which has a shape of lambda value="...", label="...": "...".
    • Change: By default, data axes will no longer be shown. You can turn it back on by the new show_data_axes parameter.

    The online documentation ~will be~ has been updated to demonstrate these new features.

    Source code(tar.gz)
    Source code(zip)
    charts.css.py-brython.js(8.11 KB)
  • 0.3.0(May 23, 2021)

    • Line chart should not accept non-zero data_spacing or datasets_spacing. Now it would rightfully reject such an input.
    • Provide an online document/sample
    • Backport to Brython 3.7 and 3.8. The recommended Brython version is still its latest version, currently 3.9.
    • Also hosted as a Brython package which can be used by <script src="https://github.com/rayluo/charts.css.py/releases/download/0.3.0/charts.css.py-brython.js"></script>. Requires Brython 3.7.5 or above.
    Source code(tar.gz)
    Source code(zip)
    charts.css.py-brython.js(7.20 KB)
  • 0.2.0(May 17, 2021)

  • 0.1.0(May 14, 2021)

    The first release contains:

    • Basic functionality including bar, column, line and area
    • An experimental helper wrapper
    • Barely enough documentation in README.md
    • Also comes with a command-line tool csv2chart. I use it for my ad-hoc test. Let me know if you find it useful.
    Source code(tar.gz)
    Source code(zip)
Colormaps for astronomers

cmastro: colormaps for astronomers 🔭 This package contains custom colormaps that have been used in various astronomical applications, similar to cmoc

Adrian Price-Whelan 12 Oct 11, 2022
Library for exploring and validating machine learning data

TensorFlow Data Validation TensorFlow Data Validation (TFDV) is a library for exploring and validating machine learning data. It is designed to be hig

688 Jan 03, 2023
A deceptively simple plotting library for Streamlit

🍅 Plost A deceptively simple plotting library for Streamlit. Because you've been writing plots wrong all this time. Getting started pip install plost

Thiago Teixeira 192 Dec 29, 2022
The open-source tool for building high-quality datasets and computer vision models

The open-source tool for building high-quality datasets and computer vision models. Website • Docs • Try it Now • Tutorials • Examples • Blog • Commun

Voxel51 2.4k Jan 07, 2023
Numerical methods for ordinary differential equations: Euler, Improved Euler, Runge-Kutta.

Numerical methods Numerical methods for ordinary differential equations are methods used to find numerical approximations to the solutions of ordinary

Aleksey Korshuk 5 Apr 29, 2022
MPL Plotter is a Matplotlib based Python plotting library built with the goal of delivering publication-quality plots concisely.

MPL Plotter is a Matplotlib based Python plotting library built with the goal of delivering publication-quality plots concisely.

Antonio López Rivera 162 Nov 11, 2022
Python scripts to manage Chia plots and drive space, providing full reports. Also monitors the number of chia coins you have.

Chia Plot, Drive Manager & Coin Monitor (V0.5 - April 20th, 2021) Multi Server Chia Plot and Drive Management Solution Be sure to ⭐ my repo so you can

338 Nov 25, 2022
An open-source tool for visual and modular block programing in python

PyFlow PyFlow is an open-source tool for modular visual programing in python ! Although for now the tool is in Beta and features are coming in bit by

1.1k Jan 06, 2023
A command line tool for visualizing CSV/spreadsheet-like data

PerfPlotter Read data from CSV files using pandas and generate interactive plots using bokeh, which can then be embedded into HTML pages and served by

Gino Mempin 0 Jun 25, 2022
DrawBot lets you draw images taken from the internet on Skribbl.io, Gartic Phone and Paint

DrawBot You don't speak french? No worries, english translation is over here. C'est quoi ? DrawBot est un logiciel codé par V2F qui va prendre possess

V2F 205 Jan 01, 2023
Friday Night Funkin - converts a chart from 4/4 time to 6/8 time, or from regular to swing tempo.

Chart to swing converter As seen in https://twitter.com/i_winxd/status/1462220493558366214 A program written in python that converts a chart from 4/4

5 Dec 23, 2022
A simple Monte Carlo simulation using Python and matplotlib library

Monte Carlo python simulation Install linux dependencies sudo apt update sudo apt install build-essential \ software-properties-commo

Samuel Terra 2 Dec 13, 2021
A comprehensive tutorial for plotting focal mechanism

Focal_Mechanisms_Demo A comprehensive tutorial for plotting focal mechanism "beach-balls" using the PyGMT package for Python. (Resulting map of this d

3 Dec 13, 2022
🎨 Python Echarts Plotting Library

pyecharts Python ❤️ ECharts = pyecharts English README 📣 简介 Apache ECharts (incubating) 是一个由百度开源的数据可视化,凭借着良好的交互性,精巧的图表设计,得到了众多开发者的认可。而 Python 是一门富有表达

pyecharts 13.1k Jan 03, 2023
Automatization of BoxPlot graph usin Python MatPlotLib and Excel

BoxPlotGraphAutomation Automatization of BoxPlot graph usin Python / Excel. This file is an automation of BoxPlot-Graph using python graph library mat

EricAugustin 1 Feb 07, 2022
BGraph is a tool designed to generate dependencies graphs from Android.bp soong files.

BGraph BGraph is a tool designed to generate dependencies graphs from Android.bp soong files. Overview BGraph (for Build-Graphs) is a project aimed at

Quarkslab 10 Dec 19, 2022
Extensible, parallel implementations of t-SNE

openTSNE openTSNE is a modular Python implementation of t-Distributed Stochasitc Neighbor Embedding (t-SNE) [1], a popular dimensionality-reduction al

Pavlin Poličar 1.1k Jan 03, 2023
Learning Convolutional Neural Networks with Interactive Visualization.

CNN Explainer An interactive visualization system designed to help non-experts learn about Convolutional Neural Networks (CNNs) For more information,

Polo Club of Data Science 6.3k Jan 01, 2023
Moscow DEG 2021 elections plots

Построение графиков на основе публичных данных о ДЭГ в Москве в 2021г. Описание Скрипты в данном репозитории позволяют собственноручно построить графи

9 Jul 15, 2022
Graphical display tools, to help students debug their class implementations in the Carcassonne family of projects

carcassonne_tools Graphical display tools, to help students debug their class implementations in the Carcassonne family of projects NOTE NOTE NOTE The

1 Nov 08, 2021