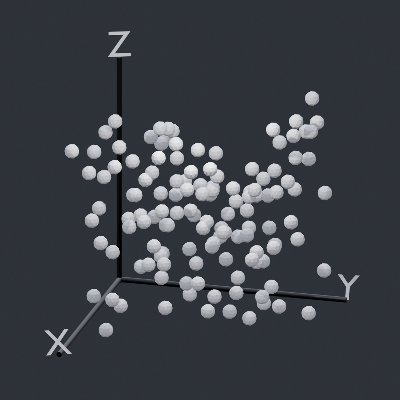
Data-FX is an addon for Blender (2.9) that allows for the visualization of data with different charts

Overview

Data-FX

Data-FX is an addon for Blender (2.9) that allows for the visualization of data with different charts

Currently, there are only 2 chart options...

  • A Scatter plot which plots up to 3 values in 3d space
  • And a "Map plot" that visualizes points on a sphere when given longitudes and latitudes

Below are some examples

How To

Data-FX is located in the View3D sidebar (N -> DataFX)

Simply select the headers from your csv file, edit your settings, and hit generate!

Notable Features

  • Custom duplicate objects (Scatter Plot)
  • Auto axis markers (Scatter Plot)
  • Auto populating .csv header selection (Scatter Plot, Map Plot)
  • Support of Geographic coordinate data (Map Plot)

Planned Features

  • More chart types
  • More supported data types
  • Various chart loading optimizations
  • Global chart menu
You might also like...
Streamlit dashboard examples - Twitter cashtags, StockTwits, WSB, Charts, SQL Pattern Scanner

streamlit-dashboards Streamlit dashboard examples - Twitter cashtags, StockTwits, WSB, Charts, SQL Pattern Scanner Tutorial Video https://ww

mysql relation charts

sqlcharts 自动生成数据库关联关系图 复制settings.py.example 重命名为settings.py 将数据库配置信息填入settings.DATABASE,目前支持mysql和postgresql 执行 python build.py -b,-b是读取数据库表结构,如果只更新匹

Altair extension for saving charts in a variety of formats.

Altair Saver This packge provides extensions to Altair for saving charts to a variety of output types. Supported output formats are: .json/.vl.json: V

🐞 📊 Ladybug extension to generate 2D charts

ladybug-charts Ladybug extension to generate 2D charts. Installation pip install ladybug-charts QuickStart import ladybug_charts API Documentation Loc

GitHub English Top Charts

Help you discover excellent English projects and get rid of the interference of other spoken language.

Simple addon for snapping active object to mesh ground

Snap to Ground Simple addon for snapping active object to mesh ground How to install: install the Python file as an addon use shortcut "D" in 3D view

Apache Superset is a Data Visualization and Data Exploration Platform

Superset A modern, enterprise-ready business intelligence web application. Why Superset? | Supported Databases | Installation and Configuration | Rele

Apache Superset is a Data Visualization and Data Exploration Platform

Apache Superset is a Data Visualization and Data Exploration Platform

Automatic data visualization in atom with the nteract data-explorer

Data Explorer Interactively explore your data directly in atom with hydrogen! The nteract data-explorer provides automatic data visualization, so you

Comments
  • Map Values in Scatter Plot

    Map Values in Scatter Plot

    Currently all values are read from the file and directly translated into their respective positions. Instead of this being hard-coded, the user should be able to choose the size of the graph they want and have the values be mapped to that range.

    enhancement 
    opened by LandonFerg 2
  • Allow Headers in CSV to be Viewed in Plugin

    Allow Headers in CSV to be Viewed in Plugin

    Right now Data-FX only uses numerics to represent the headers you want to select for your x, y and z values for generating a scatter plot. These should be represented instead by their header names to be more human readable.

    opened by LandonFerg 1
Owner
Landon Ferguson
Hello World
Landon Ferguson
These data visualizations were created as homework for my CS40 class. I hope you enjoy!

Data Visualizations These data visualizations were created as homework for my CS40 class. I hope you enjoy! Nobel Laureates by their Country of Birth

9 Sep 02, 2022
Learning Convolutional Neural Networks with Interactive Visualization.

CNN Explainer An interactive visualization system designed to help non-experts learn about Convolutional Neural Networks (CNNs) For more information,

Polo Club of Data Science 6.3k Jan 01, 2023
The visual framework is designed on the idea of module and implemented by mixin method

Visual Framework The visual framework is designed on the idea of module and implemented by mixin method. Its biggest feature is the mixins module whic

LEFTeyes 9 Sep 19, 2022
Visualize data of Vietnam's regions with interactive maps.

Plotting Vietnam Development Map This is my personal project that I use plotly to analyse and visualize data of Vietnam's regions with interactive map

1 Jun 26, 2022
This repository contains a streaming Dataflow pipeline written in Python with Apache Beam, reading data from PubSub.

Sample streaming Dataflow pipeline written in Python This repository contains a streaming Dataflow pipeline written in Python with Apache Beam, readin

Israel Herraiz 9 Mar 18, 2022
Farhad Davaripour, Ph.D. 1 Jan 05, 2022
Color scales in Python for humans

colorlover Color scales for humans IPython notebook: https://plot.ly/ipython-notebooks/color-scales/ import colorlover as cl from IPython.display impo

Plotly 146 Sep 25, 2022
plotly scatterplots which show molecule images on hover!

molplotly Plotly scatterplots which show molecule images on hovering over the datapoints! Required packages: pandas rdkit jupyter_dash ➡️ See example.

150 Dec 28, 2022
Param: Make your Python code clearer and more reliable by declaring Parameters

Param Param is a library providing Parameters: Python attributes extended to have features such as type and range checking, dynamically generated valu

HoloViz 304 Jan 07, 2023
Graphical display tools, to help students debug their class implementations in the Carcassonne family of projects

carcassonne_tools Graphical display tools, to help students debug their class implementations in the Carcassonne family of projects NOTE NOTE NOTE The

1 Nov 08, 2021
Python script for writing text on github contribution chart.

Github Contribution Drawer Python script for writing text on github contribution chart. Requirements Python 3.X Getting Started Create repository Put

Steven 0 May 27, 2022
Open-source demos hosted on Dash Gallery

Dash Sample Apps This repository hosts the code for over 100 open-source Dash apps written in Python or R. They can serve as a starting point for your

Plotly 2.7k Jan 07, 2023
🎨 Python3 binding for `@AntV/G2Plot` Plotting Library .

PyG2Plot 🎨 Python3 binding for @AntV/G2Plot which an interactive and responsive charting library. Based on the grammar of graphics, you can easily ma

hustcc 990 Jan 05, 2023
Focus on Algorithm Design, Not on Data Wrangling

The dataTap Python library is the primary interface for using dataTap's rich data management tools. Create datasets, stream annotations, and analyze model performance all with one library.

Zensors 37 Nov 25, 2022
1900-2016 Olympic Data Analysis in Python by plotting different graphs

🔥 Olympics Data Analysis 🔥 In Data Science field, there is a big topic before creating a model for future prediction is Data Analysis. We can find o

Sayan Roy 1 Feb 06, 2022
Data Visualization Guide for Presentations, Reports, and Dashboards

This is a highly practical and example-based guide on visually representing data in reports and dashboards.

Anton Zhiyanov 395 Dec 29, 2022
Plot toolbox based on Matplotlib, simple and elegant.

Elegant-Plot Plot toolbox based on Matplotlib, simple and elegant. 绘制效果 绘制过程 数据准备 每种图标类型的目录下有data.csv文件,依据样例数据填入自己的数据。

3 Jul 15, 2022
649 Pokémon palettes as CSVs, with a Python lib to turn names/IDs into palettes, or MatPlotLib compatible ListedColormaps.

PokePalette 649 Pokémon, broken down into CSVs of their RGB colour palettes. Complete with a Python library to convert names or Pokédex IDs into eithe

11 Dec 05, 2022
A blender import/export system for Defold

defold-blender-export A Blender export system for the Defold game engine. Setup Notes There are no exhaustive documents for this tool yet. Its just no

David Lannan 27 Dec 30, 2022
Runtime analysis of code with plotting

Runtime analysis of code with plotting A quick comparison among Python, Cython, and the C languages A Programming Assignment regarding the Programming

Cena Ashoori 2 Dec 24, 2021