Automatic data visualization in atom with the nteract data-explorer

Overview

Data Explorer

Interactively explore your data directly in atom with hydrogen!

The nteract data-explorer provides automatic data visualization, so you can get a feel for your data quickly and with minimal code!

nteract data explorer in hydrogen

🚧 This is a work in progress. Please open issues and pull requests!

⚠️ As this package has some open issues with styling, the following atom themes are recommended for now:

  • 🎨 Atom One Light syntax theme
  • 🎨 Atom One Light UI theme

How to try it out:

Atom packages:

  • Install both hydrogen and the data-explorer package in atom, or in the cli:
    apm install hydrogen data-explorer

Make sure you have installed:

Then, just start a python kernel in hydrogen and run the following code:

import pandas as pd

# Enable the table_schema option in pandas, 
# data-explorer makes this snippet available with the `dx` prefix:
pd.options.display.html.table_schema = True
pd.options.display.max_rows = None

# (Your dataframe here)
iris_filename = './iris.csv'
df1 = pd.read_csv(iris_filename)

df1
Comments
  • Failed to load the data-explorer package

    Failed to load the data-explorer package

    [Enter steps to reproduce:]

    1. ...
    2. ...

    Atom: 1.32.0 x64 Electron: 2.0.9 OS: Ubuntu 16.04.5 Thrown From: data-explorer package 0.3.1

    Stack Trace

    Failed to load the data-explorer package

    At Cannot find module '@blueprintjs/select'
    
    Error: Cannot find module '@blueprintjs/select'
        at Module._resolveFilename (module.js:543:15)
        at Module._resolveFilename (/usr/share/atom/resources/electron.asar/common/reset-search-paths.js:35:12)
        at Function.get_Module._resolveFilename (/usr/share/atom/resources/app/static/<embedded>:11:154364)
        at Module.require (/app.asar/static/index.js:40:43)
        at require (/usr/share/atom/resources/app/static/<embedded>:11:145671)
        at /packages/data-explorer/node_modules/@nteract/transform-dataresource/lib/VizControls.js:20:15)
        at /packages/data-explorer/node_modules/@nteract/transform-dataresource/lib/VizControls.js:391:3)
        at Module.get_Module._compile (/usr/share/atom/resources/app/static/<embedded>:11:146381)
        at Object.value [as .js] (/usr/share/atom/resources/app/static/<embedded>:11:149928)
        at Module.load (module.js:561:32)
        at tryModuleLoad (module.js:504:12)
        at Function.Module._load (module.js:496:3)
        at Module.require (/app.asar/static/index.js:47:45)
        at require (/usr/share/atom/resources/app/static/<embedded>:11:145671)
        at /packages/data-explorer/node_modules/@nteract/transform-dataresource/lib/index.js:48:43)
        at /packages/data-explorer/node_modules/@nteract/transform-dataresource/lib/index.js:495:3)
        at Module.get_Module._compile (/usr/share/atom/resources/app/static/<embedded>:11:146381)
        at Object.value [as .js] (/usr/share/atom/resources/app/static/<embedded>:11:149928)
        at Module.load (module.js:561:32)
        at tryModuleLoad (module.js:504:12)
        at Function.Module._load (module.js:496:3)
        at Module.require (/app.asar/static/index.js:47:45)
        at require (/usr/share/atom/resources/app/static/<embedded>:11:145671)
        at /packages/data-explorer/lib/common.js:33:2)
        at /packages/data-explorer/lib/common.js:11:76)
        at Module.get_Module._compile (/usr/share/atom/resources/app/static/<embedded>:11:146381)
        at Object.value [as .js] (/usr/share/atom/resources/app/static/<embedded>:11:149928)
        at Module.load (module.js:561:32)
        at tryModuleLoad (module.js:504:12)
        at Function.Module._load (module.js:496:3)
    

    Commands

    Non-Core Packages

    data-explorer 0.3.1 
    Hydrogen 2.6.0 
    hydrogen-launcher 1.2.2 
    hydrogen-python 0.0.7 
    
    opened by cchlanger 10
  • Error compiling Less stylesheet

    Error compiling Less stylesheet

    Hi,

    When installing the data-explorer, I get this error:

    Line number: 3 '../node_modules/@blueprintjs/icons/lib/css/blueprint-icons.css' wasn't found. Tried - /home/lordflaron/.atom/packages/data-explorer/node_modules/@blueprintjs/icons/lib/css/blueprint-icons.css,/usr/lib/atom/node_modules/one-light-syntax/node_modules/@blueprintjs/icons/lib/css/blueprint-icons.css,/usr/lib/atom/node_modules/one-light-ui/node_modules/@blueprintjs/icons/lib/css/blueprint-icons.css,/usr/lib/atom/static/node_modules/@blueprintjs/icons/lib/css/blueprint-icons.css,/usr/lib/atom/node_modules/@blueprintjs/icons/lib/css/blueprint-icons.css,../node_modules/@blueprintjs/icons/lib/css/blueprint-icons.css

    Is there a missing dependency I need?

    Thank you so much!

    opened by amichuda 4
  • Unable to open

    Unable to open

    I installed it using apm command, and it can open another window with the name "data-explorer/docker-view", but nothing shows up. I just use cmd+enter to execute the current line "df".

    opened by zhangpanzhan 0
  • crash after clicking on hex plot

    crash after clicking on hex plot

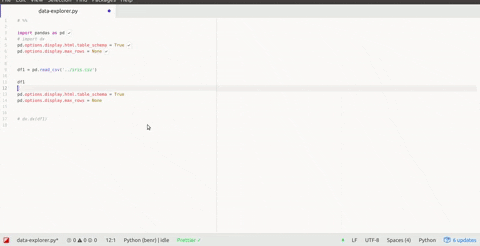
    open data frame, click on hex bin plot. It shows up but then suddenly crashes.

    Atom: 1.35.1 x64 Electron: 2.0.18 OS: Microsoft Windows 10 Pro Thrown From: data-explorer package 0.6.0

    Stack Trace

    Uncaught Invariant Violation: Minified React error #31; visit https://reactjs.org/docs/error-decoder.html?invariant=31&args[]=Thu%20Dec%2013%202018%2012%3A01%3A51%20GMT-0800%20(Pacific%20Standard%20Time)&args[]= for the full message or use the non-minified dev environment for full errors and additional helpful warnings.

    At C:\Users\dominikschneider\.atom\packages\data-explorer\node_modules\react-dom\cjs\react-dom.production.min.js:248
    
    Invariant Violation: Minified React error #31; visit https://reactjs.org/docs/error-decoder.html?invariant=31&args[]=Thu%20Dec%2013%202018%2012%3A01%3A51%20GMT-0800%20(Pacific%20Standard%20Time)&args[]= for the full message or use the non-minified dev environment for full errors and additional helpful warnings. 
        at ba (/packages/data-explorer/node_modules/react-dom/cjs/react-dom.production.min.js:13:315)
        at /packages/data-explorer/node_modules/react-dom/cjs/react-dom.production.min.js:14:166)
        at Bf (/packages/data-explorer/node_modules/react-dom/cjs/react-dom.production.min.js:137:39)
        at /packages/data-explorer/node_modules/react-dom/cjs/react-dom.production.min.js:141:49)
        at /packages/data-explorer/node_modules/react-dom/cjs/react-dom.production.min.js:143:145)
        at /packages/data-explorer/node_modules/react-dom/cjs/react-dom.production.min.js:147:131
        at /packages/data-explorer/node_modules/react-dom/cjs/react-dom.production.min.js:164:72)
        at Tg (/packages/data-explorer/node_modules/react-dom/cjs/react-dom.production.min.js:181:151)
        at bi (/packages/data-explorer/node_modules/react-dom/cjs/react-dom.production.min.js:232:22)
        at ci (/packages/data-explorer/node_modules/react-dom/cjs/react-dom.production.min.js:233:284)
        at Di (/packages/data-explorer/node_modules/react-dom/cjs/react-dom.production.min.js:249:348)
        at Yh (/packages/data-explorer/node_modules/react-dom/cjs/react-dom.production.min.js:248:144)
        at Gi (/packages/data-explorer/node_modules/react-dom/cjs/react-dom.production.min.js:250:420)
        at Kb (/packages/data-explorer/node_modules/react-dom/cjs/react-dom.production.min.js:39:140)
        at Dd (/packages/data-explorer/node_modules/react-dom/cjs/react-dom.production.min.js:86:249)
    

    Commands

         -3:17 autocomplete-plus:cancel (atom-text-editor.editor.is-focused)
         -3:16.3.0 hydrogen:run-and-move-down (input.hidden-input)
         -3:16.3.0 autocomplete-plus:cancel (atom-text-editor.editor.is-focused)
         -3:14.1.0 hydrogen:run-and-move-down (input.hidden-input)
         -3:14.1.0 autocomplete-plus:cancel (atom-text-editor.editor.is-focused)
         -3:13.6.0 hydrogen:run-and-move-down (input.hidden-input)
         -3:13.6.0 autocomplete-plus:cancel (atom-text-editor.editor.is-focused)
         -3:12.2.0 hydrogen:run-and-move-down (input.hidden-input)
         -3:12.2.0 autocomplete-plus:cancel (atom-text-editor.editor.is-focused)
         -3:11.2.0 hydrogen:run-and-move-down (input.hidden-input)
         -3:11.2.0 autocomplete-plus:cancel (atom-text-editor.editor.is-focused)
      2x -3:09.4.0 core:move-up (input.hidden-input)
      3x -2:54.5.0 core:backspace (input.hidden-input)
         -2:52.5.0 hydrogen:run (input.hidden-input)
         -2:52.5.0 autocomplete-plus:cancel (atom-text-editor.editor.is-focused.autocomplete-active)
         -2:29 settings-view:open (input.hidden-input)
    

    Non-Core Packages

    autocomplete-python-jedi 1.10.3-0 
    data-explorer 0.6.0 
    file-icons 2.1.31 
    Hydrogen 2.9.0 
    hydrogen-launcher 1.2.2 
    MagicPython 1.1.1 
    platformio-ide-terminal 2.9.1 
    tablr 1.8.3 
    
    opened by dschneiderch 0
  • column resizing issue

    column resizing issue

    Thanks for this super cool extension!

    I thought I'd point out that things go a bit haywire if you try to resize the columns. image

    I'm on Windows 10, Atom 1.34, data-explorer 0.5.0

    opened by dschneiderch 6
  • [WIP] use nteract outputs component

    [WIP] use nteract outputs component

    • [x] Make a custom outputs component that only renders data-explorer output
    • [x] Write some tests
    • [ ] Refactor and simplify the rest of the package and integrate
    • [ ] useEffects to open and close atom dock, toggle user config, and other side effects, replacing that logic in other areas of the package. (bump react to 16.8)

    This should let me up with a nicer package and some learnings to take to future packages/refactors.

    opened by BenRussert 0
Releases(v0.7.0)
Owner
Ben Russert
Video Experience team @bombbomb
Ben Russert
Bcc2telegraf: An integration that sends ebpf-based bcc histogram metrics to telegraf daemon

bcc2telegraf bcc2telegraf is an integration that sends ebpf-based bcc histogram

Peter Bobrov 2 Feb 17, 2022
Make visual music sheets for thatskygame (graphical representations of the Sky keyboard)

sky-python-music-sheet-maker This program lets you make visual music sheets for Sky: Children of the Light. It will ask you a few questions, and does

21 Aug 26, 2022
Piglet-shaders - PoC of custom shaders for Piglet

Piglet custom shader PoC This is a PoC for compiling Piglet fragment shaders usi

6 Mar 10, 2022
Squidpy is a tool for the analysis and visualization of spatial molecular data.

Squidpy is a tool for the analysis and visualization of spatial molecular data. It builds on top of scanpy and anndata, from which it inherits modularity and scalability. It provides analysis tools t

Theis Lab 251 Dec 19, 2022
A napari plugin for visualising and interacting with electron cryotomograms.

napari-tomoslice A napari plugin for visualising and interacting with electron cryotomograms. Installation You can install napari-tomoslice via pip: p

3 Jan 03, 2023
A command line tool for visualizing CSV/spreadsheet-like data

PerfPlotter Read data from CSV files using pandas and generate interactive plots using bokeh, which can then be embedded into HTML pages and served by

Gino Mempin 0 Jun 25, 2022
This is a Boids Simulation, written in Python with Pygame.

PyNBoids A Python Boids Simulation This is a Boids simulation, written in Python3, with Pygame2 and NumPy. To use: Save the pynboids_sp.py file (and n

Nik 17 Dec 18, 2022
A Python package that provides evaluation and visualization tools for the DexYCB dataset

DexYCB Toolkit DexYCB Toolkit is a Python package that provides evaluation and visualization tools for the DexYCB dataset. The dataset and results wer

NVIDIA Research Projects 107 Dec 26, 2022
Dipto Chakrabarty 7 Sep 06, 2022
📊📈 Serves up Pandas dataframes via the Django REST Framework for use in client-side (i.e. d3.js) visualizations and offline analysis (e.g. Excel)

📊📈 Serves up Pandas dataframes via the Django REST Framework for use in client-side (i.e. d3.js) visualizations and offline analysis (e.g. Excel)

wq framework 1.2k Jan 01, 2023
This component provides a wrapper to display SHAP plots in Streamlit.

streamlit-shap This component provides a wrapper to display SHAP plots in Streamlit.

Snehan Kekre 30 Dec 10, 2022
A Python library for plotting hockey rinks with Matplotlib.

Hockey Rink A Python library for plotting hockey rinks with Matplotlib. Installation pip install hockey_rink Current Rinks The following shows the cus

24 Jan 02, 2023
A small timeseries transformation API built on Flask and Pandas

#Mcflyin ###A timeseries transformation API built on Pandas and Flask This is a small demo of an API to do timeseries transformations built on Flask a

Rob Story 84 Mar 25, 2022
This is simply repo for line drawing rendering using freestyle in Blender.

blender_freestyle_line_drawing This is simply repo for line drawing rendering using freestyle in Blender. how to use blender2935 --background --python

MaxLin 3 Jul 02, 2022
Collection of scripts for making high quality beautiful math-related posters.

Poster Collection of scripts for making high quality beautiful math-related posters. The poster can have as large printing size as 3x2 square feet wit

Nattawut Phetmak 3 Jun 09, 2022
3D-Lorenz-Attractor-simulation-with-python

3D-Lorenz-Attractor-simulation-with-python Animação 3D da trajetória do Atrator de Lorenz, implementada em Python usando o método de Runge-Kutta de 4ª

Hevenicio Silva 17 Dec 08, 2022
MPL Plotter is a Matplotlib based Python plotting library built with the goal of delivering publication-quality plots concisely.

MPL Plotter is a Matplotlib based Python plotting library built with the goal of delivering publication-quality plots concisely.

Antonio López Rivera 162 Nov 11, 2022
Flipper Zero documentation repo

Flipper Zero Docs Participation To fix a bug or add something new to this repository, you need to open a pull-request. Also, on every page of the site

Flipper Zero (All Repositories will be public soon) 114 Dec 30, 2022
Rubrix is a free and open-source tool for exploring and iterating on data for artificial intelligence projects.

Open-source tool for exploring, labeling, and monitoring data for AI projects

Recognai 1.5k Jan 07, 2023
Python+Numpy+OpenGL: fast, scalable and beautiful scientific visualization

Python+Numpy+OpenGL: fast, scalable and beautiful scientific visualization

Glumpy 1.1k Jan 05, 2023