☁
Synoptic API for Python (unofficial)


The Synoptic Mesonet API (formerly MesoWest) gives you access to real-time and historical surface-based weather and environmental observations for thousands of stations.
📔
SynopticPy Documentation
Synoptic is free up to 5,000 API requests and 5 million service units each month. That's a generous amount, but if you need even more data, a paid tier is available (through Synoptic, not me).
🌐 Register for a free account at the Synoptic API WebpageYou will need to obtain an API token before using this python package.
I wrote these functions to conveniently access data from the Synoptic API and convert the JSON data to a Pandas DataFrame. This may be helpful to others who are getting started with the Synoptic API and Python. The idea is loosely based on the obsolete MesoPy python wrapper, but returning the data as a Pandas DataFrame instead of a simple dictionary, making the retrieved data more ready-to-use.
Contributing Guidelines (and disclaimer)
Since this package is a work in progress, it is distributed "as is." I do not make any guarantee it will work for you out of the box. In fact, this is my first experience publishing a package to PyPI. Any revisions I make are purely for my benefit. Sorry if I break something, but I usually only push updates to GitHub if the code is in a reasonably functional state (at least, in the way I use it).
With that said, I am happy to share this project with you. You are welcome to open issues and submit pull requests, but know that I may or may not get around to doing anything about it. If this is helpful to you in any way, I'm glad.
🐍
Installation and Conda Environment
Option 1: pip
Install the last published version from PyPI. This requires the following are already installed:
numpy, pandas, requests. It's optional, but you will want matplotlib, and cartopy, too.
pip install SynopticPy
Option 2: conda
If conda environments are new to you, I suggest you become familiar with managing conda environments.
I have provided a sample Anaconda environment.yml file that lists the minimum packages required plus some extras that might be useful when working with other types of weather data. Look at the bottom lines of that yaml file...there are two ways to install SynopticPy with pip. Comment out the lines you don't want.
For the latest development code:
- pip:
    - git+https://github.com/blaylockbk/SynopticPy.git
For the latest published version
- pip:
    - SynopticPy
First, create the virtual environment with
conda env create -f environment.yml
Then, activate the synoptic environment. Don't confuse this environment name with the package name.
conda activate synoptic
Occasionally, you might want to update all the packages in the environment.
conda env update -f environment.yml
Alternative "Install" Method
There are several other ways to "install" a python package so you can import them. One alternatively is you can
git clone https://github.com/blaylockbk/SynopticPy.gitthis repository to any directory. To import the package, you will need to update your PYTHONPATH environment variable to find the directory you put this package or add the linesys.path.append("/path/to/SynotpicPy")at the top of your python script.
🔨
Setup
Before you can retrieve data from the Synoptic API, you need to register as a Synoptic user and obtain a token. Follow the instructions at the Getting Started Page. When you have a token, edit synoptic/config.cfg with your personal API token, not your API key. The config file should look should look something like this:
[Synoptic]
token = 1234567890abcdefg
If you don't do this step, don't worry. When you import synoptic.services, a quick check will make sure the token in the config file is valid. If not, you will be prompted to update the token in the config file.
📝
Jupyter Notebook Examples
I have provided a number of notebooks on GitHub that contain some practical examples for importing and using these functions to get and show station data.
synoptic/
🎟
get_token.py
This function performs a test on the token in the config.cfg file. If the token is valid, you are good to go. If not, then you will be prompted to edit the config.cfg file when you import any function from synoptic.services.
👨🏻💻 services.py
This is the main module you will interact with. It contains functions for making API requests and returns the data as a Pandas DataFrame.
# Import all functions
import synoptic.services as ss
or
# Import a single function (prefered)
from synotpic.services import stations_timeseries
Available Functions
There is a separate function for each of the Synoptic Mesonet API services as described in the Synotpic documentation.
-
synoptic_api- A generalized wrapper for making an API request and returns arequestsobject. You could access the raw JSON from this object, but the other functions will convert that JSON to a Pandas DataFrame. Generally, you won't use this function directly. The primary role of this function is to format parameter arguments to a string the request URL needs to retrieve data.- Converts datetime input to a string
datetime(2020,1,1)>>>"202001010000"
- Converts timedelta input to a string
timedelta(hours=1)>>>"60"
- Converts lists (station IDs and variable names) to comma separated strings
["WBB", "KSLC"]>>>"WBB,KSLC"["air_temp", "wind_speed"]>>>"air_temp,wind_speed"
- Converts datetime input to a string
-
stations_metadata- Returns metadata (information) about stations. Synoptic Docs🔗 -
stations_timeseries- Return data for a period of time. Synoptic Docs🔗 -
stations_nearesttime- Return observation closest to the requested time. Synoptic Docs🔗 -
stations_latest- Return the most recent observations Synoptic Docs🔗 -
🏗 stations_precipitation- Return precipitation data (with derived quantities) Synoptic Docs🔗 -
networks- Return information about networks of stations Synoptic Docs🔗 -
networktypes- Return network category information Synoptic Docs🔗 -
variables- Return available variables Synoptic Docs🔗 -
qctypes- Return quality control information Synoptic Docs🔗 ` -
auth- Manage tokens (you are better off doing this in the browser in your Synoptic profile) Synoptic Docs🔗 -
🏗 stations_latency- Latency information for a station Synoptic Docs🔗 -
🏗 stations_qcsegments- Quality control for a period Synoptic Docs🔗
🧭
Function Parameters
Function arguments are stitched together to create a web query. The parameters you can use to filter the data depend on the API service. Synoptic's API Explorer can help you determine what parameters can be used for each service.
If the Synoptic API is new to you, I recommend you become familiar with the Station Selector arguments first. These parameters key in on specific stations or a set of stations within an area of interest (stid, radius, vars, state, etc.).
🤹🏻♂️ Examples
Some things you should know first:
- All lists are joined together into a comma separated string. For instance, if you are requesting three stations, you could do
stid=['WBB', 'KSLC', 'KMRY'], and that will be converted to a comma separated liststid='WBB,KSLC,KMRY'required for the API request URL. - Any input that is a datetime object (any datetime that can be parsed with f-string,
f'{DATE:%Y%m%d%H%M}') will be converted to a string required by the API (e.g.,start=datetime(2020,1,1)will be converted tostart='YYYYmmddHHMM'when the query is made.) - For services that requires the
withinorrecentarguments, these must be given in minutes. You may give integers for those arguments, but converting time to minutes is done automatically if you input a datetime.timedelta or a pandas datetime. For example, if you setwithin=timedelta(hours=1)orrecent=pd.to_timedelta('1d'), the function will convert the value to minutes for you.
❓ What if I don't know a station's ID?MesoWest is your friend if you don't know what stations are available or what they are named: https://mesowest.utah.edu/.
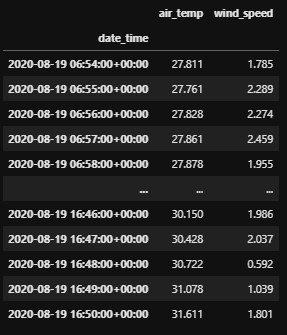
To get a time series of air temperature and wind speed for the last 10 hours for the William Browning Building (WBB) you can do...
from datetime import timedelta
from synotpic.services import stations_timeseries

df = stations_timeseries(stid='WBB',
                        vars=['air_temp', 'wind_speed'],
                        recent=timedelta(hours=10))
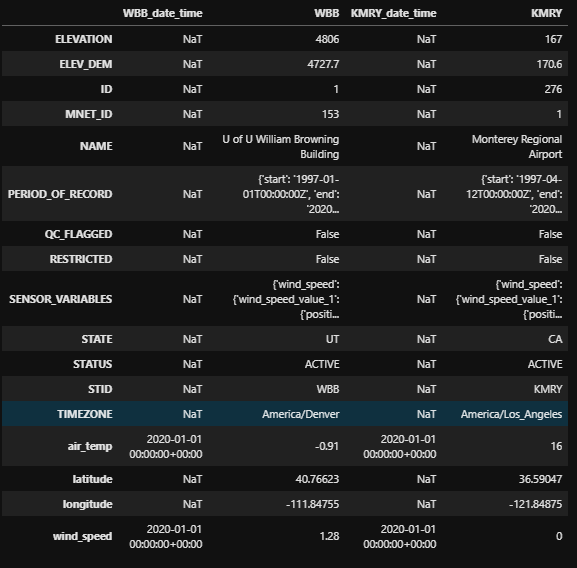
To get the latest air temperature and wind speed data for WBB (University of Utah) and KRMY (Monterey, CA airport) within one hour, we can also set the minutes as an integer instead as a timedelta.
from synotpic.services import stations_latest

df = stations_latest(stid=['WBB', 'KMRY'],
                    vars=['air_temp', 'wind_speed'],
                    within=60)

Note: Parameters may be given as a list/datetime/timedelta, or as a string/integer interpreted by the Synoptic API. Thus,
stations_latest(stid='WBB,KMRY',
                vars='air_temp,wind_speed',
                within=60)
is equivalent to the above example.
To get the air temperature and wind speed for WBB and KMRY nearest 00:00 UTC Jan 1, 2020 within one hour...
from datetime import datetime
from synotpic.services import stations_nearesttime

df = stations_latest(stid=['WBB', 'KMRY'],
                    vars=['air_temp', 'wind_speed'],
                    attime=datetime(2020,1,1),
                    within=60)
Note: the string/integer alternative to the above example is
stations_nearesttime(stid='WBB,KMRY',
                     vars='air_temp,wind_speed',
                     attime='2020010100',
                     within=60)
Use whichever is more convenient for you. I often use both methods. It depends on what I am doing.
♻
Returned Data: Variable Names
The raw data retrieved from the Synoptic API is converted from JSON to a Pandas DataFrame.
If you look at the raw JSON returned, you will see that the observation values are returned as "sets" and "values", (e.g., air_temp_set_1, pressure_set_1d, wind_speed_value_1, etc.). This is because some stations have more than one sensor for a variable (e.g., wind at more than one level at a single site) or is reported at more than one interval (e.g., ozone at 1 hr and 15 min intervals). Time series requests return "sets" and nearest time requests return "values".
I don't really like dealing with the set and value labels. Almost always, I want the set or value with the most data or the most recent observation. My functions, by default, will strip the set_1 and value_1 from the labels on the returned data. If there are more than one set or value, however, then the "set" and "value" labels will be retained for those extra sets.
- If a query returns
air_temp_set_1andair_temp_set_2, then the labels are renamedair_tempandair_temp_set_2. - If a query returns
pressure_set_1andpressure_set_1d, then the labels are renamedpressure_set_1andpressureif set_1d has more observations than set_1. - If a query returns
dew_point_temperature_value_1at 00:00 UTC anddew_point_temperature_value_1dat 00:15 UTC are both returned, then the labels are renameddew_point_temperature_value_1anddew_point_temperaturebecause the derived quantity is the most recent observation available.
In short, all sets and values are always returned, but column labels are simplified for the columns that I am most likely to use.
For the renamed columns, it is up to the user to know if the data is a derived quantity and which set/value it is. To find out, look for attributes "SENSOR_VARIABLES" and "RENAME" in the DataFrame attributes (df.attrs), or look at the raw JSON.
Doing this makes sense to me, but if you are confused and don't trust what I'm doing, you can turn this "relabeling" off with rename_set_1=False and rename_value_1=False (for the appropriate function).
🌐
Latitude and Longitude
I should mention, LATITUDE and LONGITUDE in the raw JSON is renamed to latitude and longitude (lowercase) to match CF convention.
💨
U and V Wind Components
If the returned data contains variables for both wind_speed and wind_direction, then the DataFrame will compute and return the U and V wind components as wind_u and wind_v.
⏲
Timezone
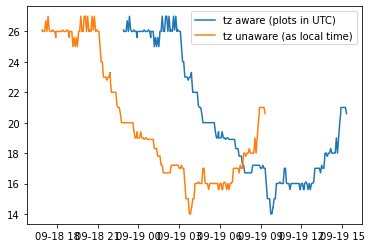
The default timezone the data is returned is in UTC time. You may change the time to local time with the parameter obtimezone=local. Pandas will return the data with a timezone-aware index. However, I found that matplotlib plotting functions convert this time back to UTC. To plot by local time, you need to use the tz_localize(None) method to make it unaware of timezone and plot local time correctly. For example, compare the two plots created with the following:
import matplotlib.pyplot as plt
from synoptic.services import stations_timeseries

df = stations_timeseries(stid='KSLC',
                        recent=1000,
                        obtimezone='local',
                        vars='air_temp')

plt.plot(df.index, df.air_temp, label='tz aware (plots in UTC)')
plt.plot(df.index.tz_localize(None), df.air_temp, label='tz unaware (as local time)')
plt.legend()
✅
How to set Synoptic's quality control checks
By default, only basic QC range checks are applied to the data before it is returned by the API. These basic checks remove physically implausible data like removing a 300 degree temperature instead of returning the value.
You can add additional QC checks that more stringently remove "bad" data that might not be representative of the area or caused by a faulty sensor. However, you can't expect every bad observation will be removed (or every good observation will be retained).
Some tips:
- You can turn on more QC checks by Synoptic with the parameter
qc_checks='synopticlabs' - You can turn all QC checks on (includes synopiclab, mesowest, and madis checks) with the parameter
qc_checks='all'. - You can see the number of data point removed in the QC summary in the DataFrame attributes
df.attrs['QC_SUMMARY']. - Specific checks can be turned on (read the docs for more details).
For example:
df = stations_timeseries(stid='UKBKB', recent=60, qc_checks='synopticlabs')
or
df = stations_timeseries(stid='UKBKB', recent=60, qc_checks='all')
Look at the QC_SUMMARY in the DataFrame attributes to see some info about what each QC check means and how many are flagged...
df.attrs['QC_SUMMARY']
>>>{'QC_SHORTNAMES': {'18': 'ma_stat_cons_check', '16': 'ma_temp_cons_check'},
    'QC_CHECKS_APPLIED': ['all'],
    'PERCENT_OF_TOTAL_OBSERVATIONS_FLAGGED': 2.03,
    'QC_SOURCENAMES': {'18': 'MADIS', '16': 'MADIS'},
    'TOTAL_OBSERVATIONS_FLAGGED': 750.0,
    'QC_NAMES': {'18': 'MADIS Spatial Consistency Check', '16': 'MADIS Temporal Consistency Check'}}
You might be able to find a better way to mask out those QC'ed values, but here is one method for the QC check for wind_speed_set_1:
# Identify which ones "passed" the QC checks (these have None in the QC array)
qc_mask = np.array([x is None for x in df.attrs['QC']['wind_speed_set_1']])
df = df.loc[qc_mask]
📈
plots.py
These are a work in progress
Some helpers for plotting data from the Synoptic API.
# Import all functions
import synoptic.plots as sp
or
# Import individual functions
from synoptic.plots import plot_timeseries
If you have stumbled across this package, I hope it is useful to you or at least gives you some ideas.
Best of Luck
-Brian


 7 Jul 06, 2022
 4 Dec 02, 2022
 1.9k Jan 04, 2023
 572 Jan 08, 2023
 504 Dec 23, 2022
 4 Apr 03, 2022
 4 Aug 04, 2022
 67 Nov 24, 2022
 206 Dec 12, 2022
 148 Dec 19, 2022
 162 Dec 05, 2022
 1 Jan 11, 2022
 134 Dec 15, 2022
 27.5k Dec 30, 2022
 719 Jan 04, 2023
 78 Aug 23, 2022
 1 Jul 12, 2022
 10 Dec 22, 2022
 5 Nov 18, 2022
 400 Dec 31, 2022