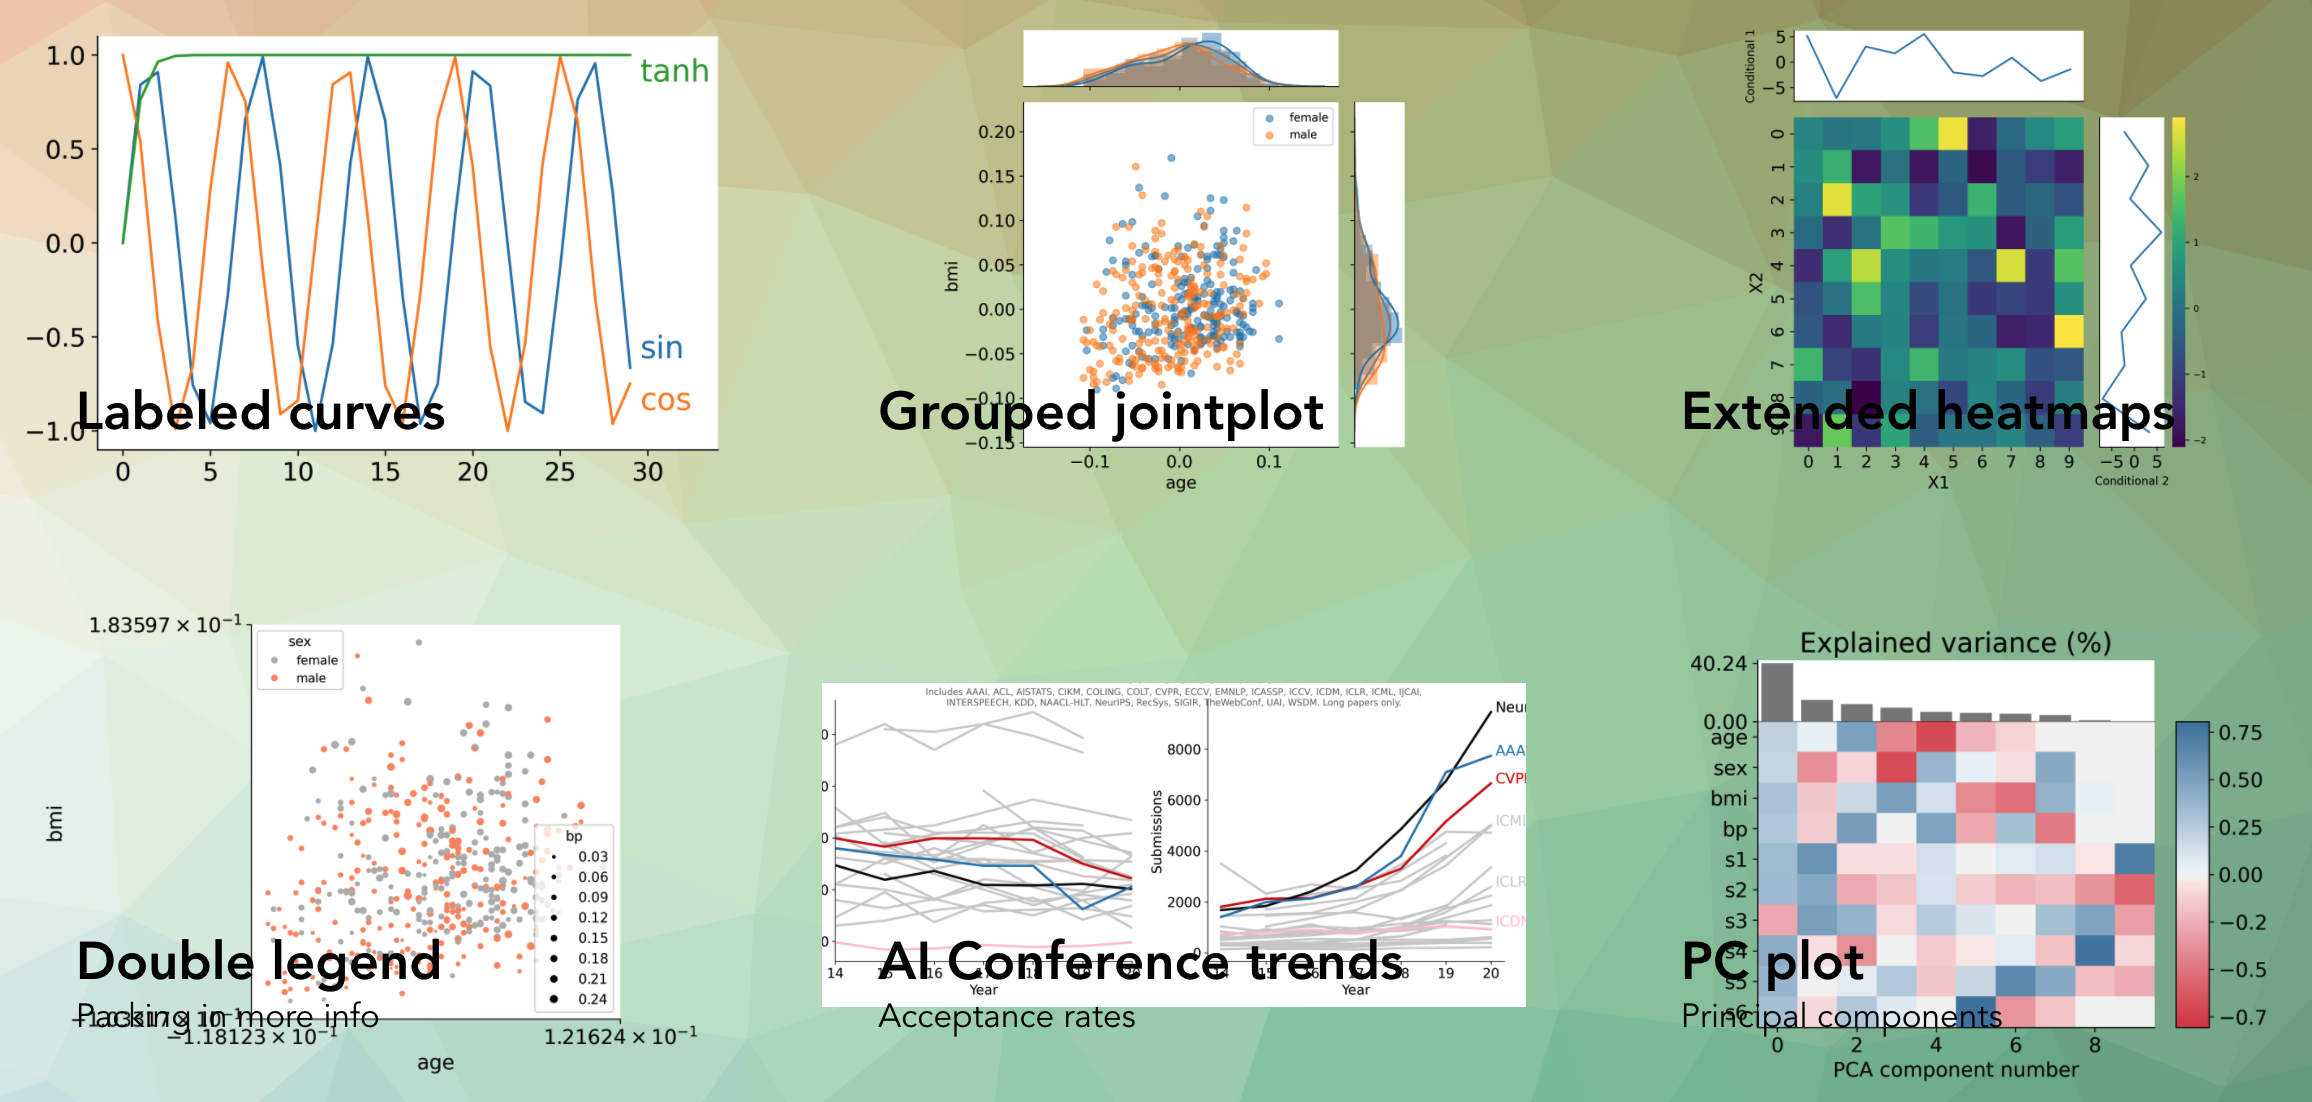
Functions for easily making publication-quality figures with matplotlib.

Overview

Data-viz utils 📈

Functions for data visualization in matplotlib

📚 API

Can be installed using pip install dvu and then imported with import dvu.

You can also just copy the relatively short source code for the functions (easily viewable here).

Helps create a bunch of different plots such as these:

One particularly useful function is dvu.line_legend() which replaces a typical matplotlib legend with labels for each line:

Using plt.legend() Using dvu.line_legend()
plt_legend dvu_legend

Another one is dvu.invert_plot() which can be called after generating a plot to invert everything besides the line colors

Original plot After dvu.invert_plot()
plt_legend dvu_legend

Reference

Owner
Chandan Singh
Working on interpretable machine learning across domains 🧠⚕️🦠 Let's do good with models.
Chandan Singh
Create charts with Python in a very similar way to creating charts using Chart.js

Create charts with Python in a very similar way to creating charts using Chart.js. The charts created are fully configurable, interactive and modular and are displayed directly in the output of the t

Nicolas H 68 Dec 08, 2022
Movie recommendation using RASA, TigerGraph

Demo run: The below video will highlight the runtime of this setup and some sample real-time conversations using the power of RASA + TigerGraph, Steps

Sudha Vijayakumar 3 Sep 10, 2022
Simple implementation of Self Organizing Maps (SOMs) with rectangular and hexagonal grid topologies

py-self-organizing-map Simple implementation of Self Organizing Maps (SOMs) with rectangular and hexagonal grid topologies. A SOM is a simple unsuperv

Jonas Grebe 1 Feb 10, 2022
Simple CLI python app to show a stocks graph performance. Made with Matplotlib and Tiingo.

stock-graph-python Simple CLI python app to show a stocks graph performance. Made with Matplotlib and Tiingo. Tiingo API Key You will need to add your

Toby 3 May 14, 2022
Uniform Manifold Approximation and Projection

UMAP Uniform Manifold Approximation and Projection (UMAP) is a dimension reduction technique that can be used for visualisation similarly to t-SNE, bu

Leland McInnes 6k Jan 08, 2023
A high performance implementation of HDBSCAN clustering. http://hdbscan.readthedocs.io/en/latest/

HDBSCAN Now a part of scikit-learn-contrib HDBSCAN - Hierarchical Density-Based Spatial Clustering of Applications with Noise. Performs DBSCAN over va

Leland McInnes 91 Dec 29, 2022
Make your BSC transaction simple.

bsc_trade_history Make your BSC transaction simple. 中文ReadMe Background: inspired by debank ,Practice my hands on this small project Blog:Crypto-BscTr

foolisheddy 7 Jul 06, 2022
100 data puzzles for pandas, ranging from short and simple to super tricky (60% complete)

100 pandas puzzles Puzzles notebook Solutions notebook Inspired by 100 Numpy exerises, here are 100* short puzzles for testing your knowledge of panda

Alex Riley 1.9k Jan 08, 2023
A tool for automatically generating 3D printable STLs from freely available lidar scan data.

mini-map-maker A tool for automatically generating 3D printable STLs from freely available lidar scan data. Screenshots Tutorial To use this script, g

Mike Abbott 51 Nov 06, 2022
HW 02 for CS40 - matplotlib practice

HW 02 for CS40 - matplotlib practice project instructions https://github.com/mikeizbicki/cmc-csci040/tree/2021fall/hw_02 Drake Lyric Analysis Bar Char

13 Oct 27, 2021
Histogramming for analysis powered by boost-histogram

Hist Hist is an analyst-friendly front-end for boost-histogram, designed for Python 3.7+ (3.6 users get version 2.4). See what's new. Installation You

Scikit-HEP Project 97 Dec 25, 2022
Interactive plotting for Pandas using Vega-Lite

pdvega: Vega-Lite plotting for Pandas Dataframes pdvega is a library that allows you to quickly create interactive Vega-Lite plots from Pandas datafra

Altair 342 Oct 26, 2022
Draw tree diagrams from indented text input

Draw tree diagrams This repository contains two very different scripts to produce hierarchical tree diagrams like this one: $ ./classtree.py collectio

Luciano Ramalho 8 Dec 14, 2022
High performance, editable, stylable datagrids in jupyter and jupyterlab

An ipywidgets wrapper of regular-table for Jupyter. Examples Two Billion Rows Notebook Click Events Notebook Edit Events Notebook Styling Notebook Pan

J.P. Morgan Chase 75 Dec 15, 2022
Process dataframe in a easily way.

Popanda Written by Shengxuan Wang at OSU. Used for processing dataframe, especially for machine learning. The name is from "Po" in the movie Kung Fu P

ShawnWang 1 Dec 24, 2021
Gallery of applications built using bqplot and widget libraries like ipywidgets, ipydatagrid etc.

bqplot Gallery This is a gallery of bqplot examples. View the gallery at https://bqplot.github.io/bqplot-gallery. Contributing new examples Clone this

8 Aug 23, 2022
Minimalistic tool to visualize how the routes to a given target domain change over time, feat. Python 3.10 & mermaid.js

Minimalistic tool to visualize how the routes to a given target domain change over time, feat. Python 3.10 & mermaid.js

Péter Ferenc Gyarmati 1 Jan 17, 2022
coordinate to draw the nimbus logo on the graffitiwall

This is a community effort to draw the nimbus logo on beaconcha.in's graffitiwall. get started clone repo with git clone https://github.com/tennisbowl

4 Apr 04, 2022
Data Visualization Guide for Presentations, Reports, and Dashboards

This is a highly practical and example-based guide on visually representing data in reports and dashboards.

Anton Zhiyanov 395 Dec 29, 2022
A simple code for plotting figure, colorbar, and cropping with python

Python Plotting Tools This repository provides a python code to generate figures (e.g., curves and barcharts) that can be used in the paper to show th

Guanying Chen 134 Jan 02, 2023