Render Jupyter notebook in the terminal

Overview

jut - JUpyter notebook Terminal viewer.

The command line tool view the IPython/Jupyter notebook in the terminal.

Install

pip install jut

Usage

$jut --help
Usage: jut [OPTIONS]

Options:
  -u, --url TEXT             Render the ipynb file from the URL
  -i, --input-file FILENAME  File from the local file-system
  -h, --head INTEGER         Display first n cells. Default is 10
  -t, --tail INTEGER         Display last n cells
  -p, --single-page          Should the result be in a single page?
  -f, --full-display         Should all the contents in the file displayed?
  --help                     Show this message and exit.

ASCIICinema Demo

asciicast

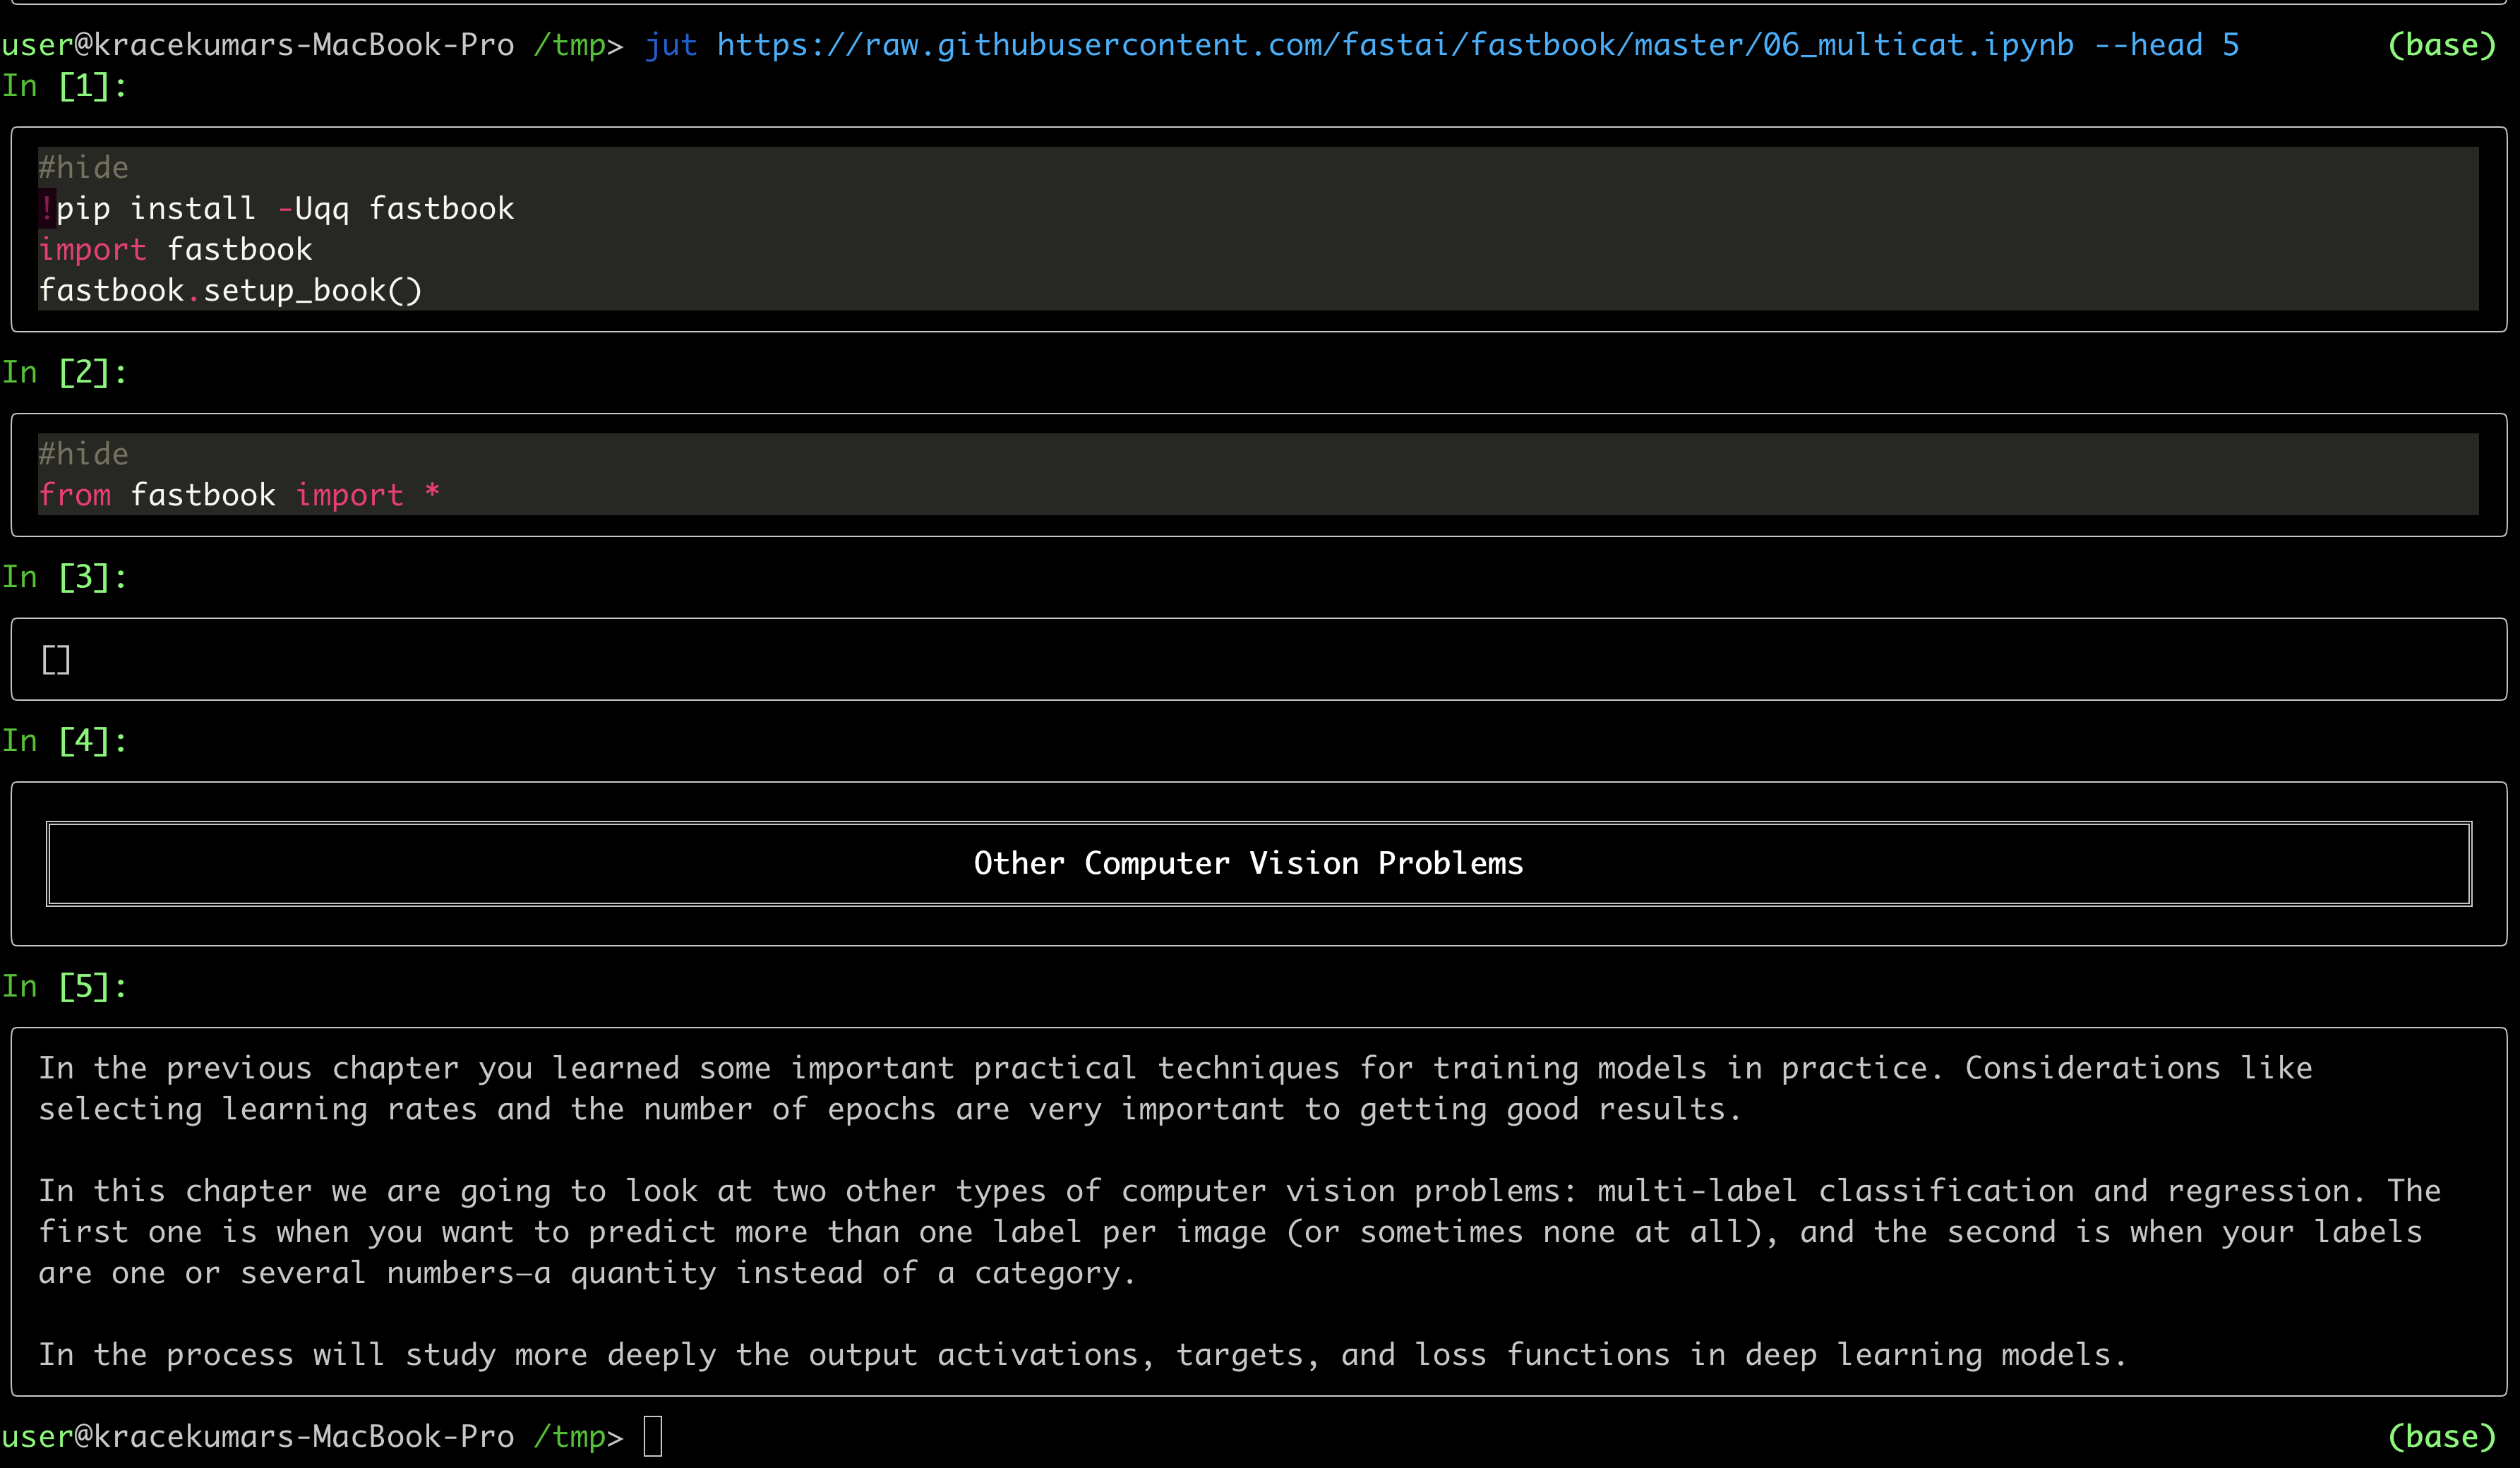
Display first five cells

jut-head-example

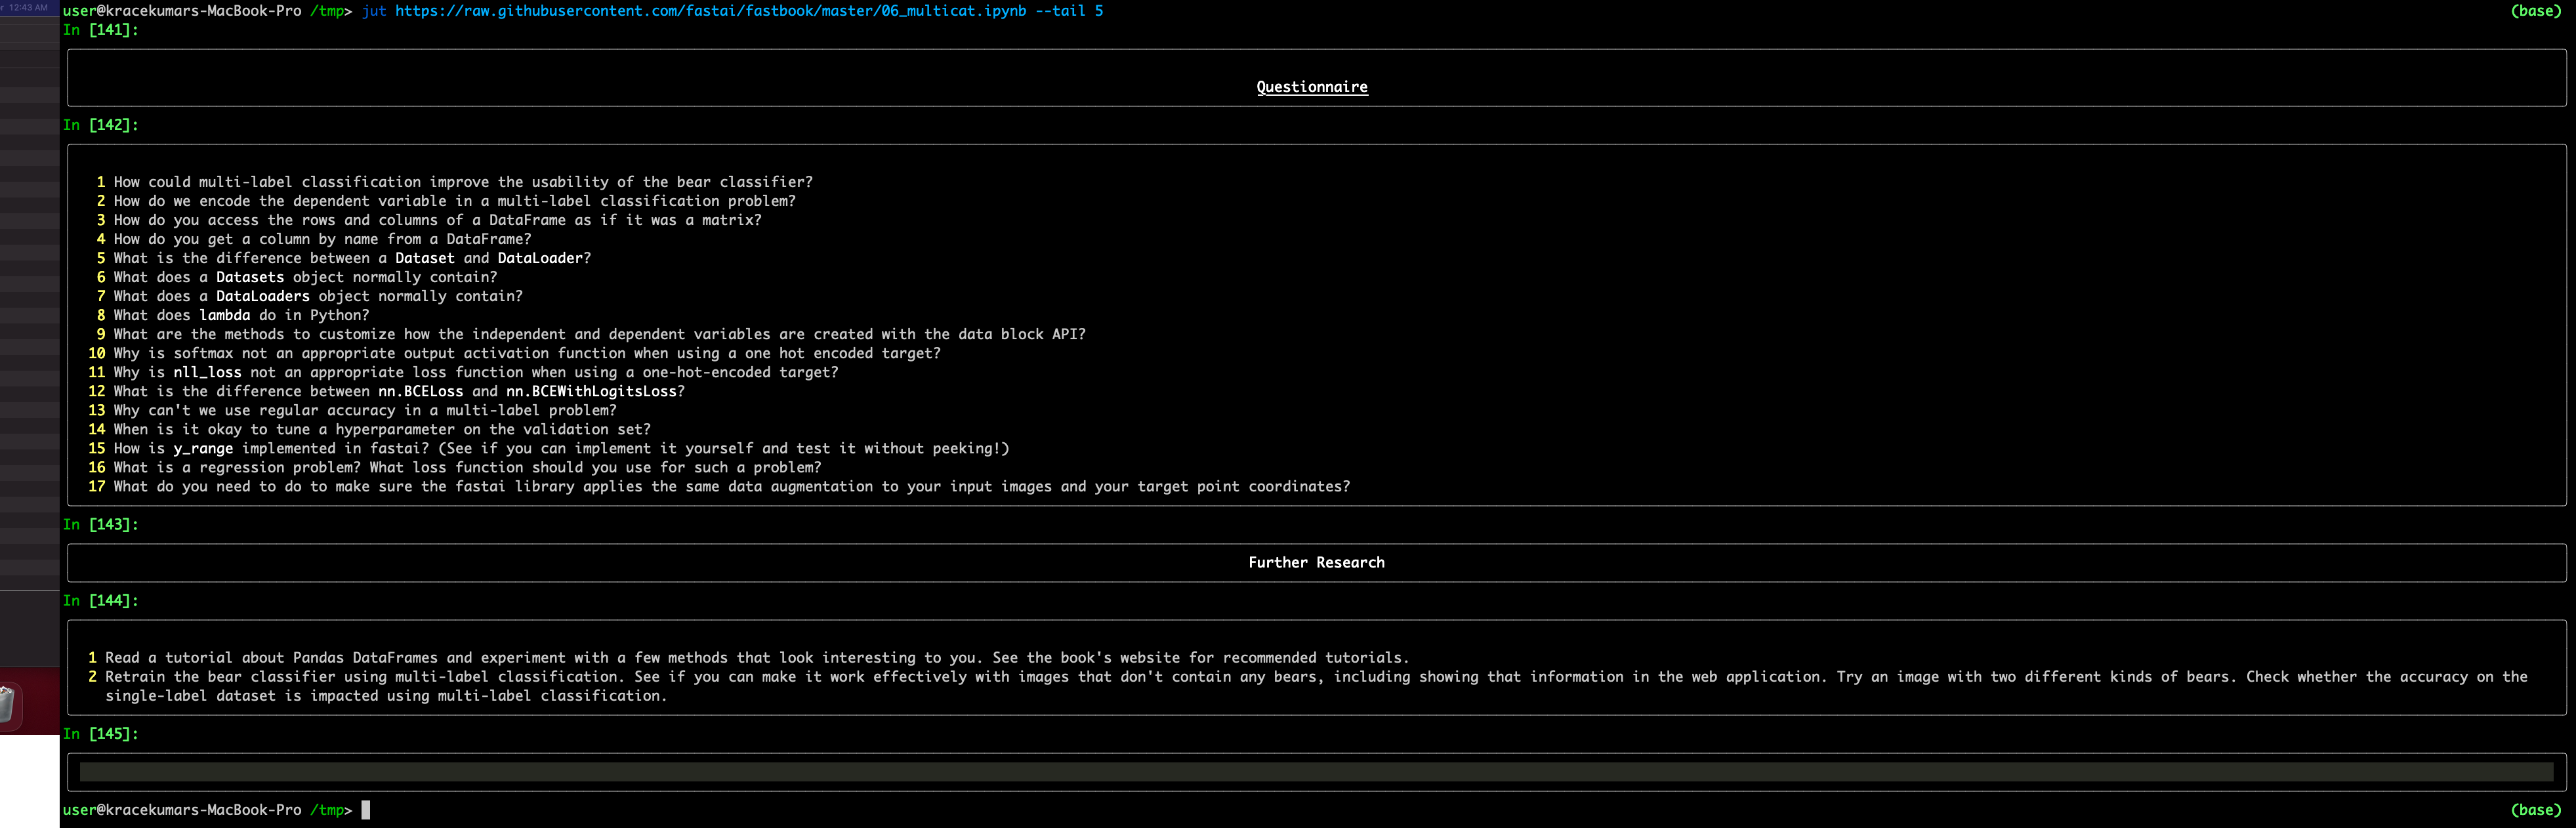
Display last five cells

jut-tail-example

Download the file and display first five cells

jut-download-url

Owner
Kracekumar
Server side guy specializing in Python. I am interested in back-end technologies, machine learning, automation, systems and performance.
Kracekumar
Lumen provides a framework for visual analytics, which allows users to build data-driven dashboards from a simple yaml specification

Lumen project provides a framework for visual analytics, which allows users to build data-driven dashboards from a simple yaml specification

HoloViz 120 Jan 04, 2023
A programming language built on top of Python to easily allow Swahili speakers to get started with programming without ever knowing English

pyswahili A programming language built over Python to easily allow swahili speakers to get started with programming without ever knowing english pyswa

Jordan Kalebu 72 Dec 15, 2022
China and India Population and GDP Visualization

China and India Population and GDP Visualization Historical Population Comparison between India and China This graph shows the population data of Indi

Nicolas De Mello 10 Oct 27, 2021
:bowtie: Create a dashboard with python!

Installation | Documentation | Gitter Chat | Google Group Bowtie Introduction Bowtie is a library for writing dashboards in Python. No need to know we

Jacques Kvam 753 Dec 22, 2022
A Python-based non-fungible token (NFT) generator built using Samilla and Matplotlib

PyNFT A Pythonic NF (non-fungible token) generator built using Samilla and Matplotlib Use python pynft.py [amount] The intention behind this generato

Ayush Gundawar 6 Feb 07, 2022
Python scripts to manage Chia plots and drive space, providing full reports. Also monitors the number of chia coins you have.

Chia Plot, Drive Manager & Coin Monitor (V0.5 - April 20th, 2021) Multi Server Chia Plot and Drive Management Solution Be sure to ⭐ my repo so you can

338 Nov 25, 2022
A tool for automatically generating 3D printable STLs from freely available lidar scan data.

mini-map-maker A tool for automatically generating 3D printable STLs from freely available lidar scan data. Screenshots Tutorial To use this script, g

Mike Abbott 51 Nov 06, 2022
Generate SVG (dark/light) images visualizing (private/public) GitHub repo statistics for profile/website.

Generate daily updated visualizations of GitHub user and repository statistics from the GitHub API using GitHub Actions for any combination of private and public repositories, whether owned or contri

Adam Ross 2 Dec 16, 2022
Peloton Stats to Google Sheets with Data Visualization through Seaborn and Plotly

Peloton Stats to Google Sheets with Data Visualization through Seaborn and Plotly Problem: 2 peloton users were looking for a way to track their metri

9 Jul 22, 2022
Designed a greedy algorithm based on Markov sequential decision-making process in MATLAB/Python to optimize using Gurobi solver

Designed a greedy algorithm based on Markov sequential decision-making process in MATLAB/Python to optimize using Gurobi solver, the wheel size, gear shifting sequence by modeling drivetrain constrai

Sabbella Prasanna 1 Jan 11, 2022
I'm doing Genuary, an aritifiacilly generated month to build code that make beautiful things

Genuary 2022 I'm doing Genuary, an aritifiacilly generated month to build code that make beautiful things. Every day there is a new prompt for making

Joaquín Feltes 1 Jan 10, 2022
Generate knowledge graphs with interesting geometries, like lattices

Geometric Graphs Generate knowledge graphs with interesting geometries, like lattices. Works on Python 3.9+ because it uses cool new features. Get out

Charles Tapley Hoyt 5 Jan 03, 2022
Write python locally, execute SQL in your data warehouse

RasgoQL Write python locally, execute SQL in your data warehouse ≪ Read the Docs · Join Our Slack » RasgoQL is a Python package that enables you to ea

Rasgo 265 Nov 21, 2022
A pandas extension that solves all problems of Jalai/Iraninan/Shamsi dates

Jalali Pandas Extentsion A pandas extension that solves all problems of Jalai/Iraninan/Shamsi dates Features Series Extenstion Convert string to Jalal

51 Jan 02, 2023
A Jupyter - Three.js bridge

pythreejs A Python / ThreeJS bridge utilizing the Jupyter widget infrastructure. Getting Started Installation Using pip: pip install pythreejs And the

Jupyter Widgets 844 Dec 27, 2022
Generate a roam research like Network Graph view from your Notion pages.

Notion Graph View Export Notion pages to a Roam Research like graph view.

Steve Sun 214 Jan 07, 2023
FairLens is an open source Python library for automatically discovering bias and measuring fairness in data

FairLens FairLens is an open source Python library for automatically discovering bias and measuring fairness in data. The package can be used to quick

Synthesized 69 Dec 15, 2022
Displaying plot of death rates from past years in Poland. Data source from these years is in readme

Average-Death-Rate Displaying plot of death rates from past years in Poland The goal collect the data from a CSV file count the ADR (Average Death Rat

Oliwier Szymański 0 Sep 12, 2021
View part of your screen in grayscale or simulated color vision deficiency.

monolens View part of your screen in grayscale or filtered to simulate color vision deficiency. Watch the demo on YouTube. Install with pip install mo

Hans Dembinski 31 Oct 11, 2022
Info for The Great DataTas plot-a-thon

The Great DataTas plot-a-thon Datatas is organising a Data Visualisation competition: The Great DataTas plot-a-thon We will be using Tidy Tuesday data

2 Nov 21, 2021