Data-sets from the survey and analysis

Overview

bachelor-thesis

"Umfragewerte.xlsx" contains the orginal survey results. "umfrage_alle.csv" contains the survey results but one participant is canceled due to response to the survey before publication time (trial run). Additionally the coloumn names have been changed to a nomenclatur-scheme which is used in the analysis part of the bachelor-thesis, describing the compared maps.

bar_all.py includes var_all.png

bar_laien_vs_erf_vs_exp.py includes bar_mittlere_std

For some plots the installation of "altair" is necessary. Using Sypder (Python 3.9) its necessary to enable the "altair_viewer" (delete the # in line 4) in all_vs_all.py using:

alt.renderers.enable('altair_viewer')

Altair can be installed, along with the example datasets in vega_datasets, using:

$ pip install altair vega_datasets $ pip install altair_viewer

If you are using the conda package manager, the equivalent is:

$ conda install -c conda-forge altair vega_datasets

You might also like...
A collection of learning outcomes data analysis using Python and SQL, from DQLab.

Data Analyst with PYTHON Data Analyst berperan dalam menghasilkan analisa data serta mempresentasikan insight untuk membantu proses pengambilan keputu

This tool parses log data and allows to define analysis pipelines for anomaly detection.

logdata-anomaly-miner This tool parses log data and allows to define analysis pipelines for anomaly detection. It was designed to run the analysis wit

 A real data analysis and modeling project - restaurant inspections
A real data analysis and modeling project - restaurant inspections

A real data analysis and modeling project - restaurant inspections Jafar Pourbemany 9/27/2021 This project represents data analysis and modeling of re

Tools for the analysis, simulation, and presentation of Lorentz TEM data.

ltempy ltempy is a set of tools for Lorentz TEM data analysis, simulation, and presentation. Features Single Image Transport of Intensity Equation (SI

Driver Analysis with Factors and Forests: An Automated Data Science Tool using Python

Driver Analysis with Factors and Forests: An Automated Data Science Tool using Python 📊

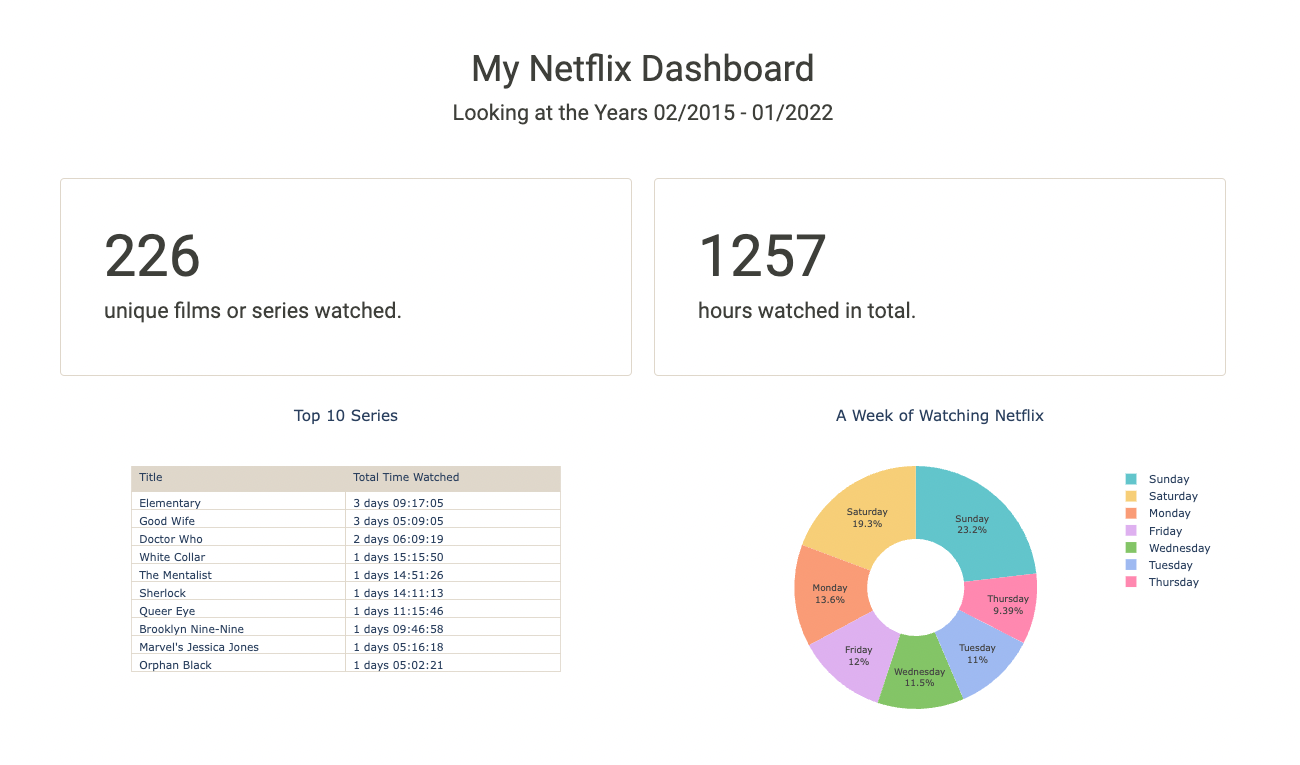
Project: Netflix Data Analysis and Visualization with Python

Project: Netflix Data Analysis and Visualization with Python Table of Contents General Info Installation Demo Usage and Main Functionalities Contribut

Amundsen is a metadata driven application for improving the productivity of data analysts, data scientists and engineers when interacting with data.

Amundsen is a metadata driven application for improving the productivity of data analysts, data scientists and engineers when interacting with data.

Flenser is a simple, minimal, automated exploratory data analysis tool.

Flenser Have you ever been handed a dataset you've never seen before? Flenser is a simple, minimal, automated exploratory data analysis tool. It runs

Visions provides an extensible suite of tools to support common data analysis operations

Visions And these visions of data types, they kept us up past the dawn. Visions provides an extensible suite of tools to support common data analysis

Pyspark Spotify ETL

This is my first Data Engineering project, it extracts data from the user's recently played tracks using Spotify's API, transforms data and then loads it into Postgresql using SQLAlchemy engine. Data

16 Jun 09, 2022
Python script to automate the plotting and analysis of percentage depth dose and dose profile simulations in TOPAS.

topas-create-graphs A script to automatically plot the results of a topas simulation Works for percentage depth dose (pdd) and dose profiles (dp). Dep

Sebastian Schäfer 10 Dec 08, 2022
DaDRA (day-druh) is a Python library for Data-Driven Reachability Analysis.

DaDRA (day-druh) is a Python library for Data-Driven Reachability Analysis. The main goal of the package is to accelerate the process of computing estimates of forward reachable sets for nonlinear dy

2 Nov 08, 2021
Advanced Pandas Vault — Utilities, Functions and Snippets (by @firmai).

PandasVault ⁠— Advanced Pandas Functions and Code Snippets The only Pandas utility package you would ever need. It has no exotic external dependencies

Derek Snow 374 Jan 07, 2023
The repo for mlbtradetrees.com. Analyze any trade in baseball history!

The repo for mlbtradetrees.com. Analyze any trade in baseball history!

7 Nov 20, 2022
Business Intelligence (BI) in Python, OLAP

Open Mining Business Intelligence (BI) Application Server written in Python Requirements Python 2.7 (Backend) Lua 5.2 or LuaJIT 5.1 (OML backend) Mong

Open Mining 1.2k Dec 27, 2022
General Assembly's 2015 Data Science course in Washington, DC

DAT8 Course Repository Course materials for General Assembly's Data Science course in Washington, DC (8/18/15 - 10/29/15). Instructor: Kevin Markham (

Kevin Markham 1.6k Jan 07, 2023
Repositori untuk menyimpan material Long Course STMKGxHMGI tentang Geophysical Python for Seismic Data Analysis

Long Course "Geophysical Python for Seismic Data Analysis" Instruktur: Dr.rer.nat. Wiwit Suryanto, M.Si Dipersiapkan oleh: Anang Sahroni Waktu: Sesi 1

Anang Sahroni 0 Dec 04, 2021
My solution to the book A Collection of Data Science Take-Home Challenges

DS-Take-Home Solution to the book "A Collection of Data Science Take-Home Challenges". Note: Please don't contact me for the dataset. This repository

Jifu Zhao 1.5k Jan 03, 2023
Python beta calculator that retrieves stock and market data and provides linear regressions.

Stock and Index Beta Calculator Python script that calculates the beta (β) of a stock against the chosen index. The script retrieves the data and resa

sammuhrai 4 Jul 29, 2022
Manage large and heterogeneous data spaces on the file system.

signac - simple data management The signac framework helps users manage and scale file-based workflows, facilitating data reuse, sharing, and reproduc

Glotzer Group 109 Dec 14, 2022
Elasticsearch tool for easily collecting and batch inserting Python data and pandas DataFrames

ElasticBatch Elasticsearch buffer for collecting and batch inserting Python data and pandas DataFrames Overview ElasticBatch makes it easy to efficien

Dan Kaslovsky 21 Mar 16, 2022
Display the behaviour of a realtime program with a scope or logic analyser.

1. A monitor for realtime MicroPython code This library provides a means of examining the behaviour of a running system. It was initially designed to

Peter Hinch 17 Dec 05, 2022
This is an example of how to automate Ridit Analysis for a dataset with large amount of questions and many item attributes

This is an example of how to automate Ridit Analysis for a dataset with large amount of questions and many item attributes

Ishan Hegde 1 Nov 17, 2021
Intake is a lightweight package for finding, investigating, loading and disseminating data.

Intake: A general interface for loading data Intake is a lightweight set of tools for loading and sharing data in data science projects. Intake helps

Intake 851 Jan 01, 2023
Data and code accompanying the paper Politics and Virality in the Time of Twitter

Politics and Virality in the Time of Twitter Data and code accompanying the paper Politics and Virality in the Time of Twitter. In specific: the code

Cardiff NLP 3 Jul 02, 2022
A set of tools to analyse the output from TraDIS analyses

QuaTradis (Quadram TraDis) A set of tools to analyse the output from TraDIS analyses Contents Introduction Installation Required dependencies Bioconda

Quadram Institute Bioscience 2 Feb 16, 2022
t-SNE and hierarchical clustering are popular methods of exploratory data analysis, particularly in biology.

tree-SNE t-SNE and hierarchical clustering are popular methods of exploratory data analysis, particularly in biology. Building on recent advances in s

Isaac Robinson 61 Nov 21, 2022
Data Competition: automated systems that can detect whether people are not wearing masks or are wearing masks incorrectly

Table of contents Introduction Dataset Model & Metrics How to Run Quickstart Install Training Evaluation Detection DATA COMPETITION The COVID-19 pande

Thanh Dat Vu 1 Feb 27, 2022