2D maze path solver visualizer implemented with python

Overview

Maze PathFinder Visualizer implemented in Python

How to use

Download:

git clone https://github.com/ss892714028/Maze-PathFinder-Visualization-Python

Install required Libraries

pip install -r requirements.txt

Settings

Go to config.py and change settings.

  • 'w': width of the board
  • 'h': height of the board
  • 'algo':'bfs' for Breadth first search
  • 'algo':'dfs' for Depth first search
  • 'algo':'astar' for A*

Run the visualization

python ./src/drawer.py
  • The first two left clicks on the board initialize start and end node
  • Click or click and drag to create obstacles
  • Press space bar and see the algorithm takes off!

Symbols

  • "@": Start and end node
  • "#": Obstacles
  • "*": Visited node
  • "+": Path

Contributions

All contributions are welcome. :)

Algorithm Implemented

  • BFS (unweighted Dijastra)
  • DFS
  • ASTAR (A*)

Breadth First Search (unweighted Dijkstra)

Breadth First Search is unweighted and guarantee a optimal path. BFS

Depth First Search

Depth First Search is unweighted and does not guarantee a optimal path. DFS

Astar (A*)

A* is weighted and guarantee a optimal path.
A* easy A*

You might also like...
A python visualization of the A* path finding algorithm

A python visualization of the A* path finding algorithm. It allows you to pick your start, end location and make obstacles and then view the process of finding the shortest path. You can also choose to include or exclude diagonal movement.

Create 3d loss surface visualizations, with optimizer path. Issues welcome!

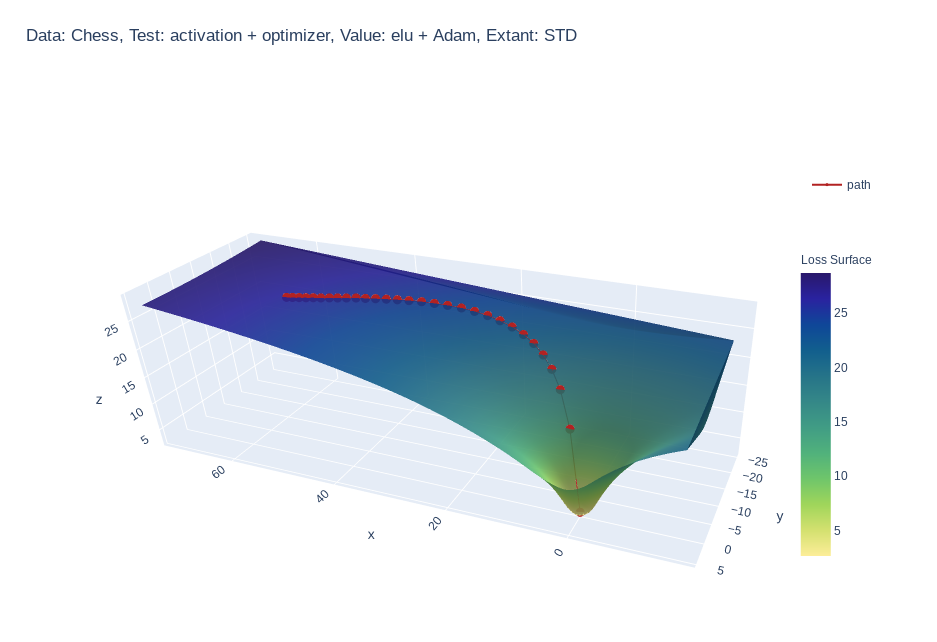
MLVTK A loss surface visualization tool Simple feed-forward network trained on chess data, using elu activation and Adam optimizer Simple feed-forward

Fastest Gephi's ForceAtlas2 graph layout algorithm implemented for Python and NetworkX

ForceAtlas2 for Python A port of Gephi's Force Atlas 2 layout algorithm to Python 2 and Python 3 (with a wrapper for NetworkX and igraph). This is the

The visual framework is designed on the idea of module and implemented by mixin method

Visual Framework The visual framework is designed on the idea of module and implemented by mixin method. Its biggest feature is the mixins module whic

Simple plotting for Python. Python wrapper for D3xter - render charts in the browser with simple Python syntax.

PyDexter Simple plotting for Python. Python wrapper for D3xter - render charts in the browser with simple Python syntax. Setup $ pip install PyDexter

Visual Python is a GUI-based Python code generator, developed on the Jupyter Notebook environment as an extension.

Visual Python is a GUI-based Python code generator, developed on the Jupyter Notebook environment as an extension.

A Python Binder that merge 2 files with any extension by creating a new python file and compiling it to exe which runs both payloads.

Update ! ANONFILE MIGHT NOT WORK ! About A Python Binder that merge 2 files with any extension by creating a new python file and compiling it to exe w

Declarative statistical visualization library for Python

Altair http://altair-viz.github.io Altair is a declarative statistical visualization library for Python. With Altair, you can spend more time understa

Interactive Data Visualization in the browser, from  Python
Interactive Data Visualization in the browser, from Python

Bokeh is an interactive visualization library for modern web browsers. It provides elegant, concise construction of versatile graphics, and affords hi

Releases(v0.1)
Runtime analysis of code with plotting

Runtime analysis of code with plotting A quick comparison among Python, Cython, and the C languages A Programming Assignment regarding the Programming

Cena Ashoori 2 Dec 24, 2021
Area-weighted venn-diagrams for Python/matplotlib

Venn diagram plotting routines for Python/Matplotlib Routines for plotting area-weighted two- and three-circle venn diagrams. Installation The simples

Konstantin Tretyakov 400 Dec 31, 2022
The official colors of the FAU as matplotlib/seaborn colormaps

FAU - Colors The official colors of Friedrich-Alexander-Universität Erlangen-Nürnberg (FAU) as matplotlib / seaborn colormaps. We support the old colo

Machine Learning and Data Analytics Lab FAU 9 Sep 05, 2022
EPViz is a tool to aid researchers in developing, validating, and reporting their predictive modeling outputs.

EPViz (EEG Prediction Visualizer) EPViz is a tool to aid researchers in developing, validating, and reporting their predictive modeling outputs. A lig

Jeff 2 Oct 19, 2022
Because trello only have payed options to generate a RunUp chart, this solves that!

Trello Runup Chart Generator The basic concept of the project is that Corello is pay-to-use and want to use Trello To-Do/Doing/Done automation with gi

Rômulo Schiavon 1 Dec 21, 2021
Data Visualizer for Super Mario Kart (SNES)

Data Visualizer for Super Mario Kart (SNES)

MrL314 21 Nov 20, 2022
The visual framework is designed on the idea of module and implemented by mixin method

Visual Framework The visual framework is designed on the idea of module and implemented by mixin method. Its biggest feature is the mixins module whic

LEFTeyes 9 Sep 19, 2022
A Python Binder that merge 2 files with any extension by creating a new python file and compiling it to exe which runs both payloads.

Update ! ANONFILE MIGHT NOT WORK ! About A Python Binder that merge 2 files with any extension by creating a new python file and compiling it to exe w

Vesper 15 Oct 12, 2022
Histogramming for analysis powered by boost-histogram

Hist Hist is an analyst-friendly front-end for boost-histogram, designed for Python 3.7+ (3.6 users get version 2.4). See what's new. Installation You

Scikit-HEP Project 97 Dec 25, 2022
Create SVG drawings from vector geodata files (SHP, geojson, etc).

SVGIS Create SVG drawings from vector geodata files (SHP, geojson, etc). SVGIS is great for: creating small multiples, combining lots of datasets in a

Neil Freeman 78 Dec 09, 2022
RockNext is an Open Source extending ERPNext built on top of Frappe bringing enterprise ready utilization.

RockNext is an Open Source extending ERPNext built on top of Frappe bringing enterprise ready utilization.

Matheus Breguêz 13 Oct 12, 2022
FairLens is an open source Python library for automatically discovering bias and measuring fairness in data

FairLens FairLens is an open source Python library for automatically discovering bias and measuring fairness in data. The package can be used to quick

Synthesized 69 Dec 15, 2022
erdantic is a simple tool for drawing entity relationship diagrams (ERDs) for Python data model classes

erdantic is a simple tool for drawing entity relationship diagrams (ERDs) for Python data model classes. Diagrams are rendered using the venerable Graphviz library.

DrivenData 129 Jan 04, 2023
Visualizing weather changes across the world using third party APIs and Python.

WEATHER FORECASTING ACROSS THE WORLD Overview Python scripts were created to visualize the weather for over 500 cities across the world at varying di

G Johnson 0 Jun 12, 2021
Data aggregated from the reports found at the MCPS COVID Dashboard into a set of visualizations.

Montgomery County Public Schools COVID-19 Visualizer Contents About this project Data Support this project About this project Data All data we use can

James 3 Jan 19, 2022
Python library that makes it easy for data scientists to create charts.

Chartify Chartify is a Python library that makes it easy for data scientists to create charts. Why use Chartify? Consistent input data format: Spend l

Spotify 3.2k Jan 04, 2023
Political elections, appointment, analysis and visualization in Python

Political elections, appointment, analysis and visualization in Python poli-sci-kit is a Python package for political science appointment and election

Andrew Tavis McAllister 9 Dec 01, 2022
Make sankey, alluvial and sankey bump plots in ggplot

The goal of ggsankey is to make beautiful sankey, alluvial and sankey bump plots in ggplot2

David Sjoberg 156 Jan 03, 2023
basemap - Plot on map projections (with coastlines and political boundaries) using matplotlib.

Basemap Plot on map projections (with coastlines and political boundaries) using matplotlib. ⚠️ Warning: this package is being deprecated in favour of

Matplotlib Developers 706 Dec 28, 2022
An intuitive library to add plotting functionality to scikit-learn objects.

Welcome to Scikit-plot Single line functions for detailed visualizations The quickest and easiest way to go from analysis... ...to this. Scikit-plot i

Reiichiro Nakano 2.3k Dec 31, 2022