view cool stats related to your discord account.

Overview

DiscoStats

cool statistics generated using your discord data.
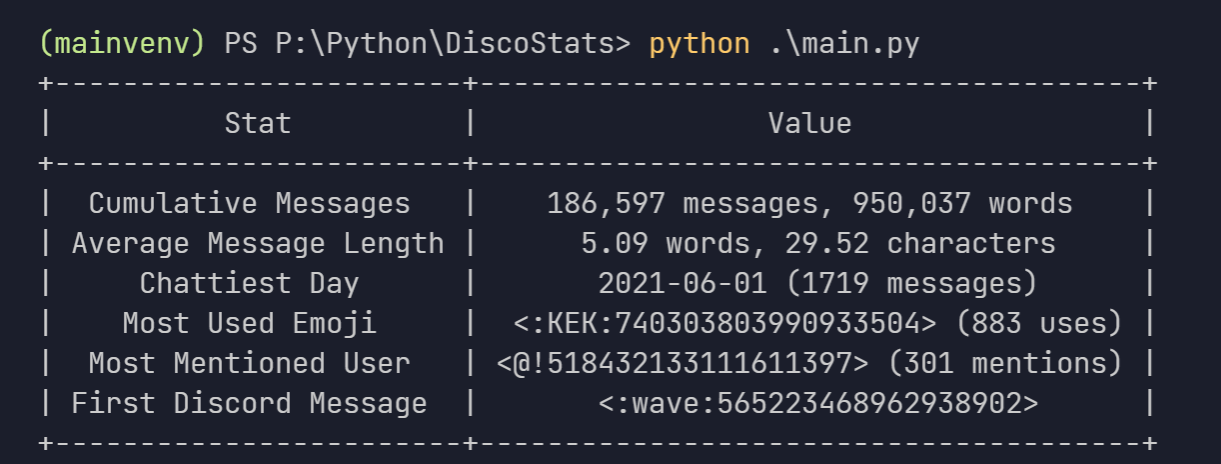
image

How?

DiscoStats is not a service that breaks the Discord Terms of Service or Community Guidelines. Discord has an option to request data which is what this entire application is based upon. It just scans through the lines of text of every message you have ever sent and generates statistics based upon that. As a forewarning, you need to request your data to use the application, which could potentially take up to 30 days.

Installation

⚠️ make sure you have python 3.7+ installed.

  • Clone the repository:
git clone https://github.com/ibra/DiscoStats
  • Install the dependencies:
pip install -r requirements.txt
  • Move your discord data inside the project directory, make sure it is all dumped under one "package" folder.
  • run main file:
python main.py  
  • optionally use the --dir flag to pinpoint the package location to a specific directory:
python main.py --dir otherFolder/package

Known Limitations

  • the name of servers, channels, users etc. cannot be displayed as there is no way to do that without having a bot or some sort of authorization within the server itself
  • the names of the emojis alone cannot be used because there could be conflicts between different servers, so its more convenient for them to be displayed in the <:Emoji:12345678910> format.
Owner
ibrahim hisham
student, programmer & hobbyist indie game developer
ibrahim hisham
The windML framework provides an easy-to-use access to wind data sources within the Python world, building upon numpy, scipy, sklearn, and matplotlib. Renewable Wind Energy, Forecasting, Prediction

windml Build status : The importance of wind in smart grids with a large number of renewable energy resources is increasing. With the growing infrastr

Computational Intelligence Group 125 Dec 24, 2022
A python script and steps to display locations of peers connected to qbittorrent

A python script (along with instructions) to display the locations of all the peers your qBittorrent client is connected to in a Grafana worldmap dash

62 Dec 07, 2022
Productivity Tools for Plotly + Pandas

Cufflinks This library binds the power of plotly with the flexibility of pandas for easy plotting. This library is available on https://github.com/san

Jorge Santos 2.7k Dec 30, 2022
A programming language built on top of Python to easily allow Swahili speakers to get started with programming without ever knowing English

pyswahili A programming language built over Python to easily allow swahili speakers to get started with programming without ever knowing english pyswa

Jordan Kalebu 72 Dec 15, 2022
The repository is my code for various types of data visualization cases based on the Matplotlib library.

ScienceGallery The repository is my code for various types of data visualization cases based on the Matplotlib library. It summarizes the code and cas

Warrick Xu 2 Apr 20, 2022
This is a web application to visualize various famous technical indicators and stocks tickers from user

Visualizing Technical Indicators Using Python and Plotly. Currently facing issues hosting the application on heroku. As soon as I am able to I'll like

4 Aug 04, 2022
📊📈 Serves up Pandas dataframes via the Django REST Framework for use in client-side (i.e. d3.js) visualizations and offline analysis (e.g. Excel)

📊📈 Serves up Pandas dataframes via the Django REST Framework for use in client-side (i.e. d3.js) visualizations and offline analysis (e.g. Excel)

wq framework 1.2k Jan 01, 2023
Automatic data visualization in atom with the nteract data-explorer

Data Explorer Interactively explore your data directly in atom with hydrogen! The nteract data-explorer provides automatic data visualization, so you

Ben Russert 65 Dec 01, 2022
A curated list of awesome Dash (plotly) resources

Awesome Dash A curated list of awesome Dash (plotly) resources Dash is a productive Python framework for building web applications. Written on top of

Luke Singham 1.7k Dec 26, 2022
Data parsing and validation using Python type hints

pydantic Data validation and settings management using Python type hinting. Fast and extensible, pydantic plays nicely with your linters/IDE/brain. De

Samuel Colvin 12.1k Jan 06, 2023
Simple, realtime visualization of neural network training performance.

pastalog Simple, realtime visualization server for training neural networks. Use with Lasagne, Keras, Tensorflow, Torch, Theano, and basically everyth

Rewon Child 416 Dec 29, 2022
Generate knowledge graphs with interesting geometries, like lattices

Geometric Graphs Generate knowledge graphs with interesting geometries, like lattices. Works on Python 3.9+ because it uses cool new features. Get out

Charles Tapley Hoyt 5 Jan 03, 2022
Datapane is the easiest way to create data science reports from Python.

Datapane Teams | Documentation | API Docs | Changelog | Twitter | Blog Share interactive plots and data in 3 lines of Python. Datapane is a Python lib

Datapane 744 Jan 06, 2023
Some problems of SSLC ( High School ) before outputs and after outputs

Some problems of SSLC ( High School ) before outputs and after outputs 1] A Python program and its output (output1) while running the program is given

Fayas Noushad 3 Dec 01, 2021
A minimal Python package that produces slice plots through h5m DAGMC geometry files

A minimal Python package that produces slice plots through h5m DAGMC geometry files Installation pip install dagmc_geometry_slice_plotter Python API U

Fusion Energy 4 Dec 02, 2022
Visualization ideas for data science

Nuance I use Nuance to curate varied visualization thoughts during my data scientist career. It is not yet a package but a list of small ideas. Welcom

Li Jiangchun 16 Nov 03, 2022
Certificate generating and sending system written in Python.

Certificate Generator & Sender How to use git clone https://github.com/saadhaxxan/Certificate-Generator-Sender.git cd Certificate-Generator-Sender Add

Saad Hassan 11 Dec 01, 2022
Python package to Create, Read, Write, Edit, and Visualize GSFLOW models

pygsflow pyGSFLOW is a python package to Create, Read, Write, Edit, and Visualize GSFLOW models API Documentation pyGSFLOW API documentation can be fo

pyGSFLOW 21 Dec 14, 2022
BrowZen correlates your emotional states with the web sites you visit to give you actionable insights about how you spend your time browsing the web.

BrowZen BrowZen correlates your emotional states with the web sites you visit to give you actionable insights about how you spend your time browsing t

Nick Bild 36 Sep 28, 2022
Frbmclust - Clusterize FRB profiles using hierarchical clustering, plot corresponding parameters distributions

frbmclust Getting Started Clusterize FRB profiles using hierarchical clustering,

3 May 06, 2022