BrowZen correlates your emotional states with the web sites you visit to give you actionable insights about how you spend your time browsing the web.

Overview

BrowZen

BrowZen correlates your emotional states with the web sites you visit to give you actionable insights about how you spend your time browsing the web.

How It Works

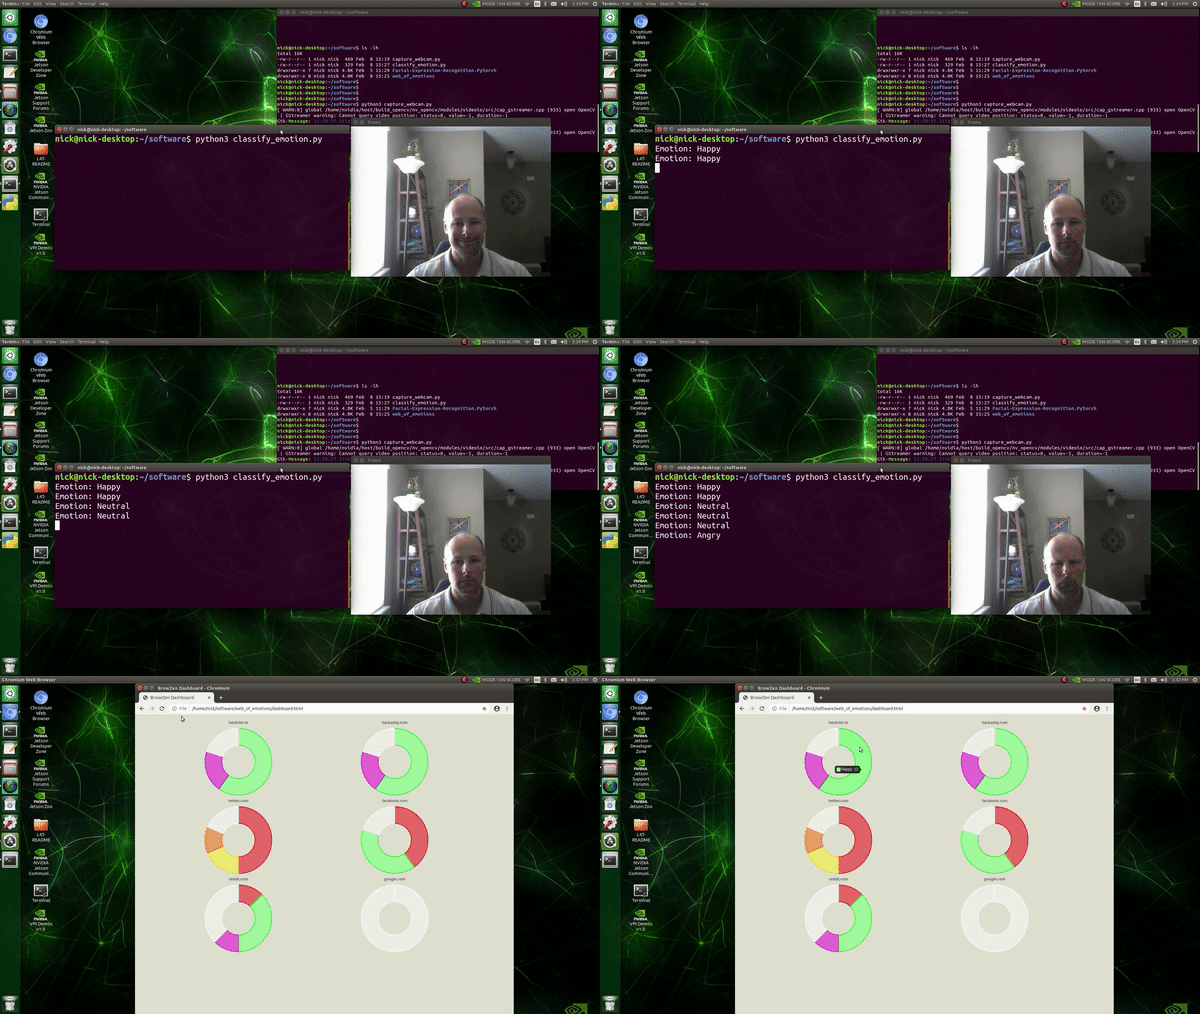
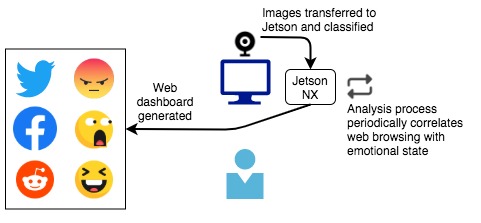
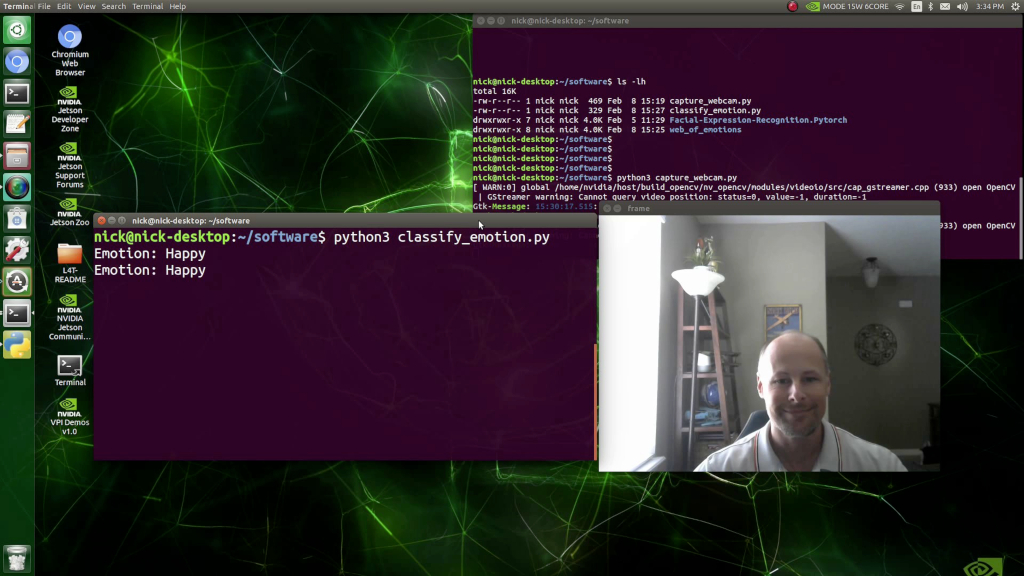
A webcam attached to an NVIDIA Jetson Xavier NX captures periodic images of the user of the computer as a background process. These images are classified (see classify_emotion.py) by a VGG19 convolutional neural network that has been pretrained to recognize seven emotional states ("Angry", "Disgust", "Fear", "Happy", "Sad", "Surprise", and "Neutral"). Observations (emotional state, datetime stamp) are recorded in an SQLite3 database. For privacy protection, images are destroyed after classification, and all processing takes place locally—nothing is sent to the cloud.

Next, analysis.py connects to the SQLite3 database that stores web history in Chrome/Chromium and correlates web site visit times with the database of emotional state observations created by the classification step. The result of the analysis, the sum of each emotional state observed while visiting each web site, is stored in an SQLite3 database table.

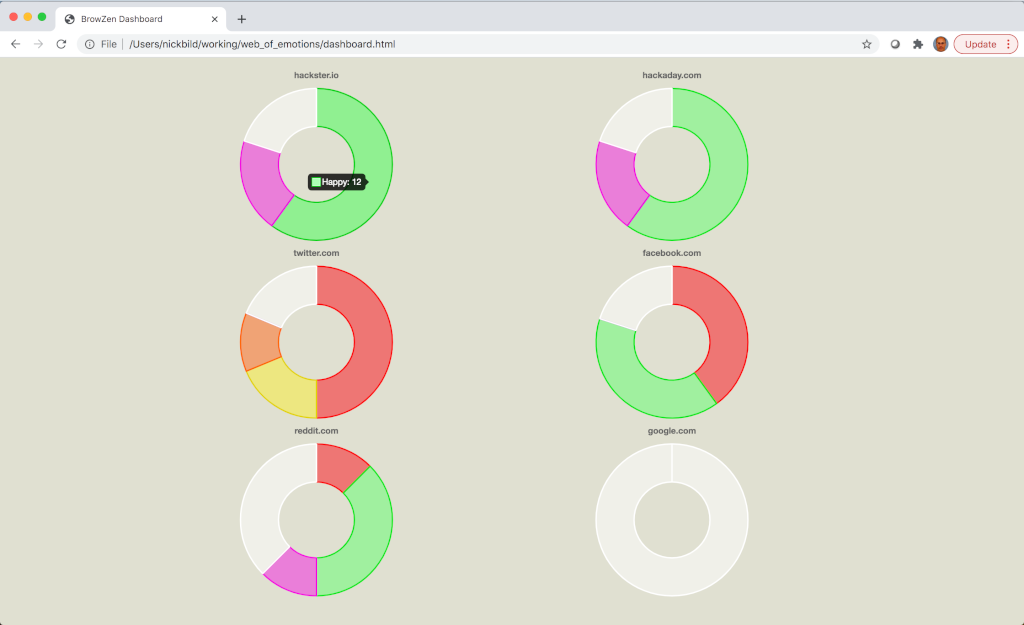
Finally, the analysis results are used to generate a web dashboard (generate_dashboard.py) to provide a simple way to visualize, on average, how each web site one visits impacts their emotional state. The web dashboard (dashboard.html) relies on only HTML5 and JavaScript.

Media

Demo Video: YouTube

The web dashboard, giving an overview of emotional reactions during visits to various websites (high resolution): Dashboard
Classifying emotions in real-time (high resolution): Classification
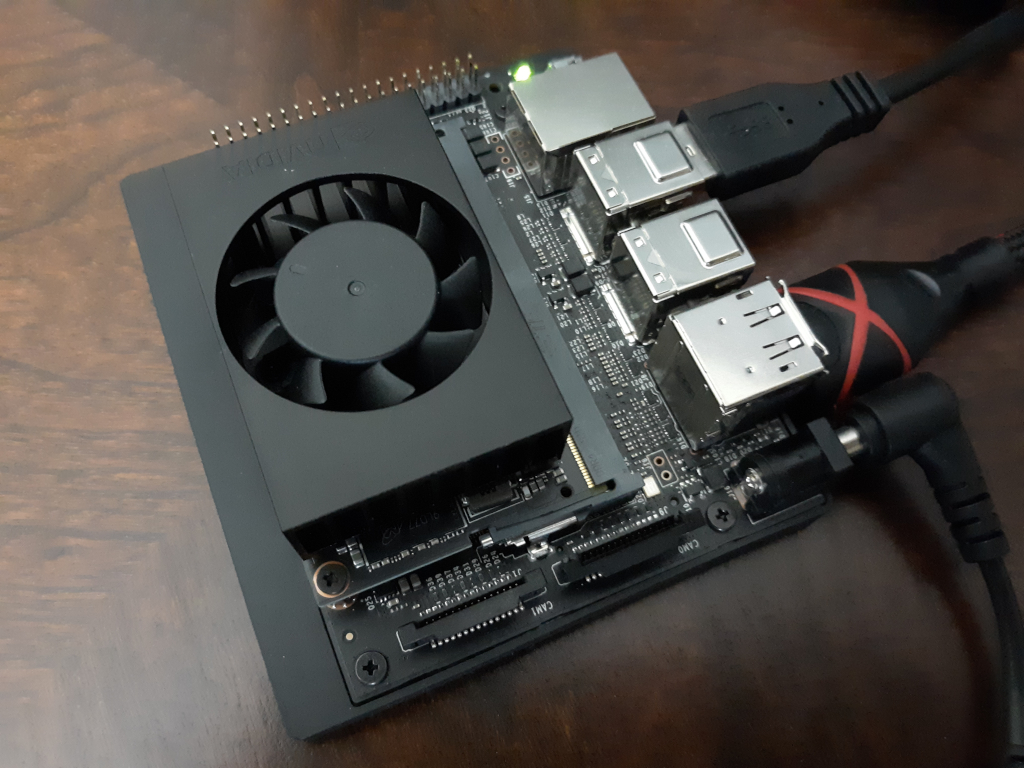
Jetson Xavier NX (high resolution): Jetson

Future Direction

It may be useful to create a browser plugin that displays a small, always-visible icon representing past emotions experienced when visiting the current website. This would serve as a quick reminder of past experiences that may modify current behavior.

I would like to also explore other areas, beyond web browsing, where this idea may be helpful.

Bill of Materials

  • 1 x NVIDIA Jetson Xavier NX
  • 1 x USB webcam

About the Author

Nick A. Bild, MS

Owner
Nick Bild
R&D, creativity, and building the next big thing you never knew you wanted are my specialties.
Nick Bild
Simple and lightweight Spotify Overlay written in Python.

Simple Spotify Overlay This is a simple yet powerful Spotify Overlay. About I have been looking for something like this ever since I got Spotify. I th

27 Sep 03, 2022
I'm doing Genuary, an aritifiacilly generated month to build code that make beautiful things

Genuary 2022 I'm doing Genuary, an aritifiacilly generated month to build code that make beautiful things. Every day there is a new prompt for making

Joaquín Feltes 1 Jan 10, 2022
A command line tool for visualizing CSV/spreadsheet-like data

PerfPlotter Read data from CSV files using pandas and generate interactive plots using bokeh, which can then be embedded into HTML pages and served by

Gino Mempin 0 Jun 25, 2022
The windML framework provides an easy-to-use access to wind data sources within the Python world, building upon numpy, scipy, sklearn, and matplotlib. Renewable Wind Energy, Forecasting, Prediction

windml Build status : The importance of wind in smart grids with a large number of renewable energy resources is increasing. With the growing infrastr

Computational Intelligence Group 125 Dec 24, 2022
Generate knowledge graphs with interesting geometries, like lattices

Geometric Graphs Generate knowledge graphs with interesting geometries, like lattices. Works on Python 3.9+ because it uses cool new features. Get out

Charles Tapley Hoyt 5 Jan 03, 2022
649 Pokémon palettes as CSVs, with a Python lib to turn names/IDs into palettes, or MatPlotLib compatible ListedColormaps.

PokePalette 649 Pokémon, broken down into CSVs of their RGB colour palettes. Complete with a Python library to convert names or Pokédex IDs into eithe

11 Dec 05, 2022
The Python ensemble sampling toolkit for affine-invariant MCMC

emcee The Python ensemble sampling toolkit for affine-invariant MCMC emcee is a stable, well tested Python implementation of the affine-invariant ense

Dan Foreman-Mackey 1.3k Jan 04, 2023
Pebble is a stat's visualization tool, this will provide a skeleton to develop a monitoring tool.

Pebble is a stat's visualization tool, this will provide a skeleton to develop a monitoring tool.

Aravind Kumar G 2 Nov 17, 2021
Jupyter Notebook extension leveraging pandas DataFrames by integrating DataTables and ChartJS.

Jupyter DataTables Jupyter Notebook extension to leverage pandas DataFrames by integrating DataTables JS. About Data scientists and in fact many devel

Marek Čermák 142 Dec 28, 2022
PanGraphViewer -- show panenome graph in an easy way

PanGraphViewer -- show panenome graph in an easy way Table of Contents Versions and dependences Desktop-based panGraphViewer Library installation for

16 Dec 17, 2022
python partial dependence plot toolbox

PDPbox python partial dependence plot toolbox Motivation This repository is inspired by ICEbox. The goal is to visualize the impact of certain feature

Li Jiangchun 723 Jan 07, 2023
Chem: collection of mostly python code for molecular visualization, QM/MM, FEP, etc

chem: collection of mostly python code for molecular visualization, QM/MM, FEP,

5 Sep 02, 2022
Browse Dash docsets inside emacs

Helm Dash What's it This package uses Dash docsets inside emacs to browse documentation. Here's an article explaining the basic usage of it. It doesn'

504 Dec 15, 2022
A filler visualizer built using python

filler-visualizer 42 filler のログをビジュアライズしてスポーツさながら楽しむことができます! Usage (標準入力でvisualizer.pyに渡せばALL OK) 1. 既にあるログをビジュアライズする $ ./filler_vm -t 3 -p1 john_fill

Takumi Hara 1 Nov 04, 2021
Learn Data Science with focus on adding value with the most efficient tech stack.

DataScienceWithPython Get started with Data Science with Python An engaging journey to become a Data Scientist with Python TL;DR Download all Jupyter

Learn Python with Rune 110 Dec 22, 2022
Handout for the tutorial "Creating publication-quality figures with matplotlib"

Handout for the tutorial "Creating publication-quality figures with matplotlib"

JB Mouret 1.9k Jan 02, 2023
Tweets your monthly GitHub Contributions as Wordle grid

Tweets your monthly GitHub Contributions as Wordle grid

Venu Vardhan Reddy Tekula 5 Feb 16, 2022
Collection of data visualizing projects through Tableau, Data Wrapper, and Power BI

Data-Visualization-Projects Collection of data visualizing projects through Tableau, Data Wrapper, and Power BI Indigenous-Brands-Social-Movements Pyt

Jinwoo(Roy) Yoon 1 Feb 05, 2022
Interactive Dashboard for Visualizing OSM Data Change

Dashboard and intuitive data downloader for more interactive experience with interpreting osm change data.

1 Feb 20, 2022
Small project to recursively calculate and plot each successive order of the Hilbert Curve

hilbert-curve Small project to recursively calculate and plot each successive order of the Hilbert Curve. After watching 3Blue1Brown's video on Hilber

Stefan Mejlgaard 2 Nov 15, 2021