🌐 Local tile server for viewing geospatial raster files with ipyleaflet or folium

Overview

🌐 Local Tile Server for Geospatial Rasters

codecov PyPI

Need to visualize a rather large (gigabytes) raster you have locally? This is for you.

A Flask application for serving tiles from large raster files in the Slippy Maps standard (i.e., /zoom/x/y.png)

tile-diagram

🌟 Highlights

  • Create a local tile server for large geospatial images
  • View local or remote* raster files with ipyleaflet or folium
  • Extract regions of interest (ROIs) interactively
  • Use the example datasets to generate Digital Elevation Models
  • Visualize rasters with the included CesiumJS web viewer

*remote raster files should be pre-tiled Cloud Optimized GeoTiffs

ℹ️ Overview

Under the hood, this uses large_image to launch a tile server in a background thread which will serve raster imagery to a tile viewer (see ipyleaflet and folium examples below). This tile server can efficiently deliver varying levels of detail of your raster imagery to your viewer; it helps to have pre-tiled, Cloud Optimized GeoTIFFs (COG), but no wories if not as large_image will tile and cache for you when opening the raster.

There is an included, standalone web viewer leveraging CesiumJS and GeoJS. You can use the web viewer to select and extract regions of interest from rasters.

Disclaimer: I put this together over a weekend and I'm definitely going to change a few things moving forward to make it more stable/robust. This means that things will most likely break between minor releases (I use the major.minor.patch versioning scheme).

⬇️ Installation

Install from PyPI: https://pypi.org/project/localtileserver/

pip install localtileserver

📝 A Brief Note on Installing GDAL

GDAL can be a pain in the 🍑 to install, and you may want to handle GDAL before installing localtileserver.

If on linux, I highly recommend using the large_image_wheels from Kitware.

pip install --find-links=https://girder.github.io/large_image_wheels --no-cache GDAL

Otherwise, I recommend using conda:

conda install -c conda-forge GDAL

💭 Feedback

Please share your thoughts and questions on the Discussions board. If you would like to report any bugs or make feature requests, please open an issue.

If filing a bug report, please share a scooby Report:

import localtileserver
print(localtileserver.Report())

🚀 Usage

🍃 ipyleaflet Tile Layers

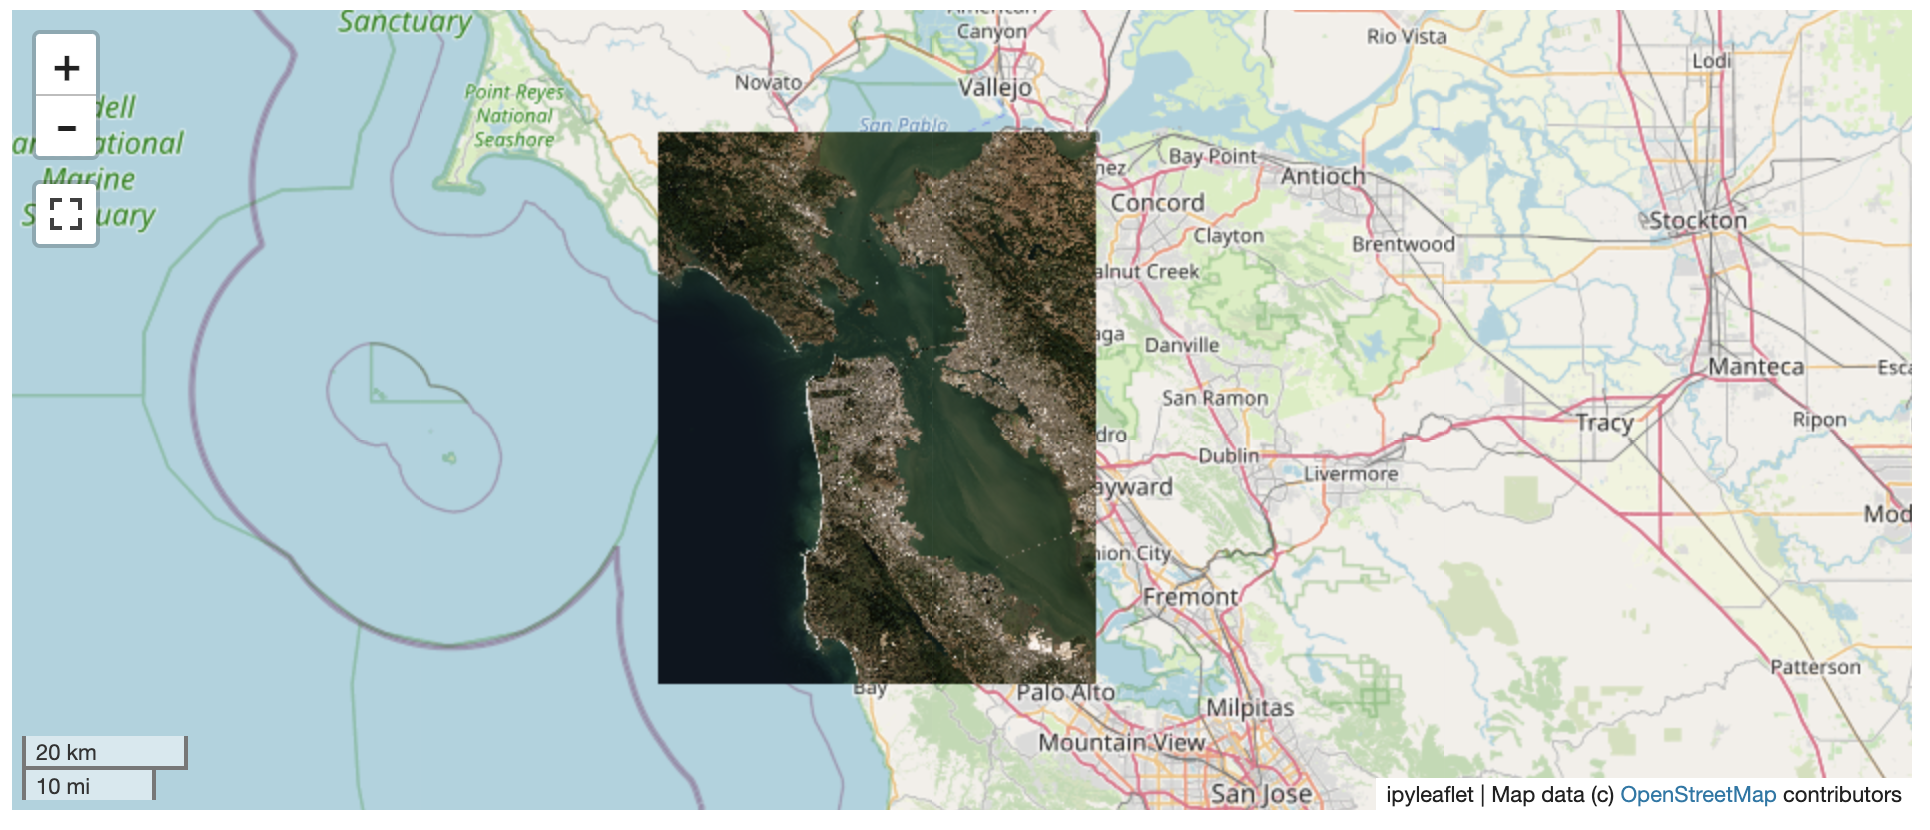
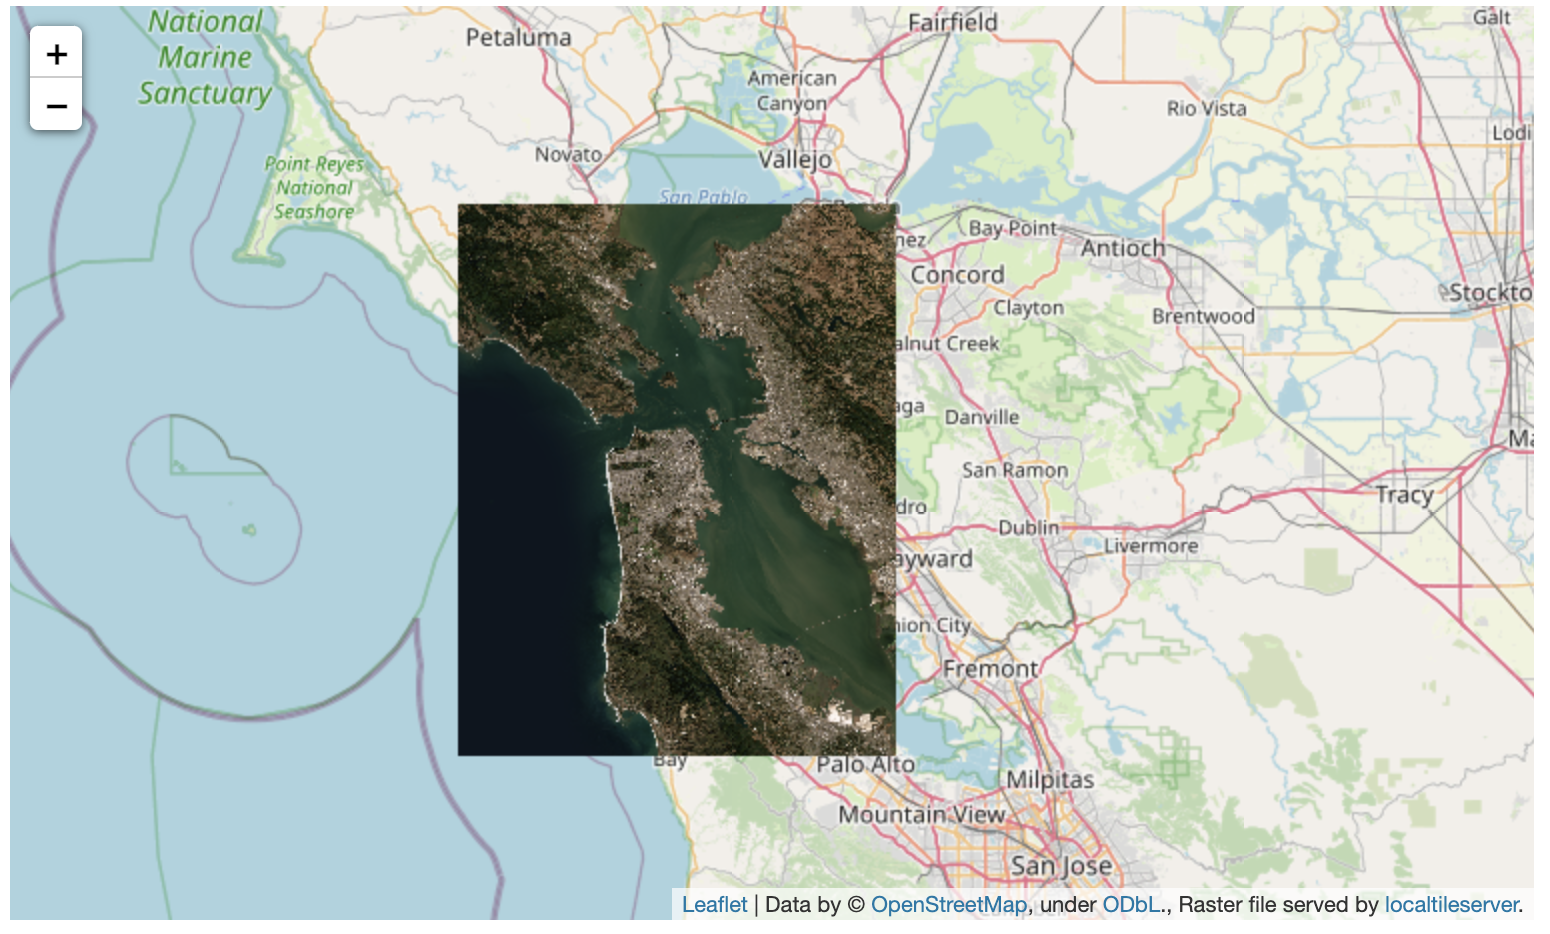
The TileClient class is a nifty tool to launch a tile server as a background thread to serve image tiles from any raster file on your local file system. Additionally, it can be used in conjunction with the get_leaflet_tile_layer utility to create an ipyleaflet.TileLayer for interactive visualization in a Jupyter notebook. Here is an example:

from localtileserver import get_leaflet_tile_layer, TileClient
from ipyleaflet import Map

# First, create a tile server from local raster file
tile_client = TileClient('~/Desktop/TC_NG_SFBay_US_Geo.tif')

# Create ipyleaflet tile layer from that server
t = get_leaflet_tile_layer(tile_client)

# Create ipyleaflet map, add tile layer, and display
m = Map(center=tile_client.center())
m.add_layer(t)
m

ipyleaflet

🥓 Two Rasters at Once

from localtileserver import get_leaflet_tile_layer
from ipyleaflet import Map, ScaleControl, FullScreenControl, SplitMapControl

# Create 2 tile layers from 2 separate raster files
l = get_leaflet_tile_layer('~/Desktop/TC_NG_SFBay_US_Geo.tif',
                           band=1, palette='matplotlib.Viridis_20', vmin=50, vmax=200)
r = get_leaflet_tile_layer('~/Desktop/small.tif',
                           band=2, palette='matplotlib.Plasma_6', vmin=0, vmax=150)

# Make the ipyleaflet map
m = Map(center=(37.7249511580583, -122.27230466902257), zoom=9)
control = SplitMapControl(left_layer=l, right_layer=r)
m.add_control(control)
m.add_control(ScaleControl(position='bottomleft'))
m.add_control(FullScreenControl())
m

ipyleaflet-double

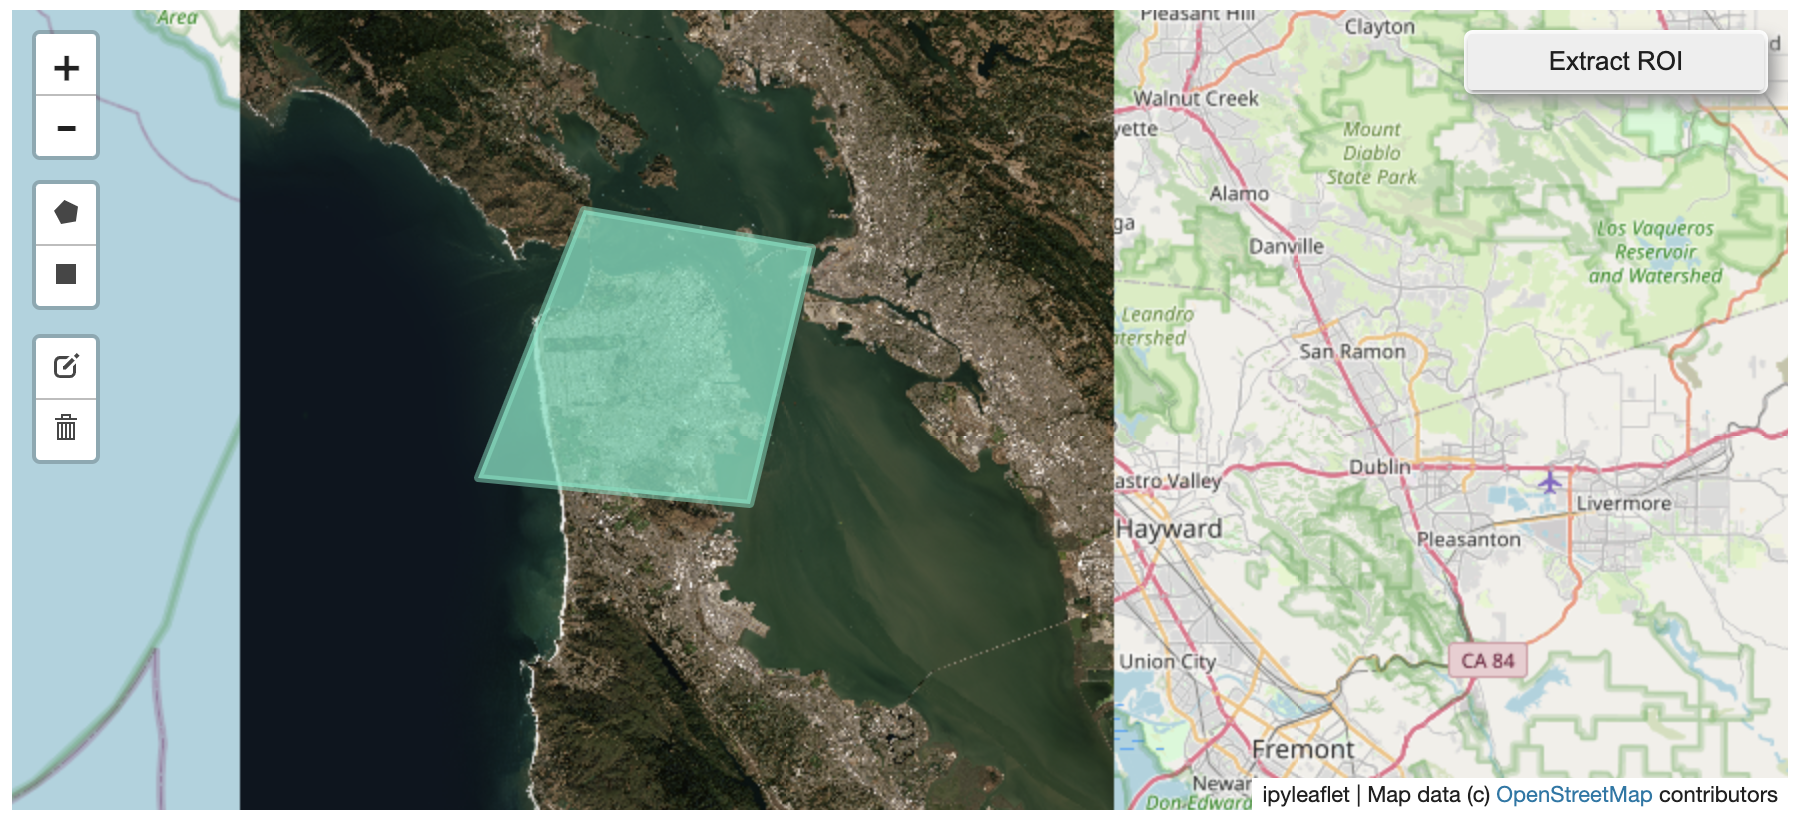
🎯 Using ipyleaflet for ROI Extraction

I have included the get_leaflet_roi_controls utility to create some leaflet UI controls for extracting regions of interest from a tile client. You can use it as follows and then draw a polygon and click the "Extract ROI" button.

The outputs are save in your working directory by default (next to the Jupyter notebook).

from localtileserver import get_leaflet_tile_layer, get_leaflet_roi_controls
from localtileserver import TileClient
from ipyleaflet import Map

# First, create a tile server from local raster file
tile_client = TileClient('~/Desktop/TC_NG_SFBay_US_Geo.tif')

# Create ipyleaflet tile layer from that server
t = get_leaflet_tile_layer(tile_client)

# Create ipyleaflet controls to extract an ROI
draw_control, roi_control = get_leaflet_roi_controls(tile_client)

# Create ipyleaflet map, add layers, add controls, and display
m = Map(center=(37.7249511580583, -122.27230466902257), zoom=9)
m.add_layer(t)
m.add_control(draw_control)
m.add_control(roi_control)
m

ipyleaflet-draw-roi

🌳 folium Tile Layers

Similarly to the support provided for ipyleaflet, I have included a utility to generate a folium.TileLayer with get_folium_tile_layer. Here is an example with almost the exact same code as the ipyleaflet example, just note that Map is imported from folium and we use add_child instead of add_layer:

from localtileserver import get_folium_tile_layer
from localtileserver import TileClient
from folium import Map

# First, create a tile server from local raster file
tile_client = TileClient('~/Desktop/TC_NG_SFBay_US_Geo.tif')

# Create folium tile layer from that server
t = get_folium_tile_layer(tile_client)

m = Map(location=tile_client.center())
m.add_child(t)
m

folium

☁️ Remote Cloud Optimized GeoTiffs (COGs)

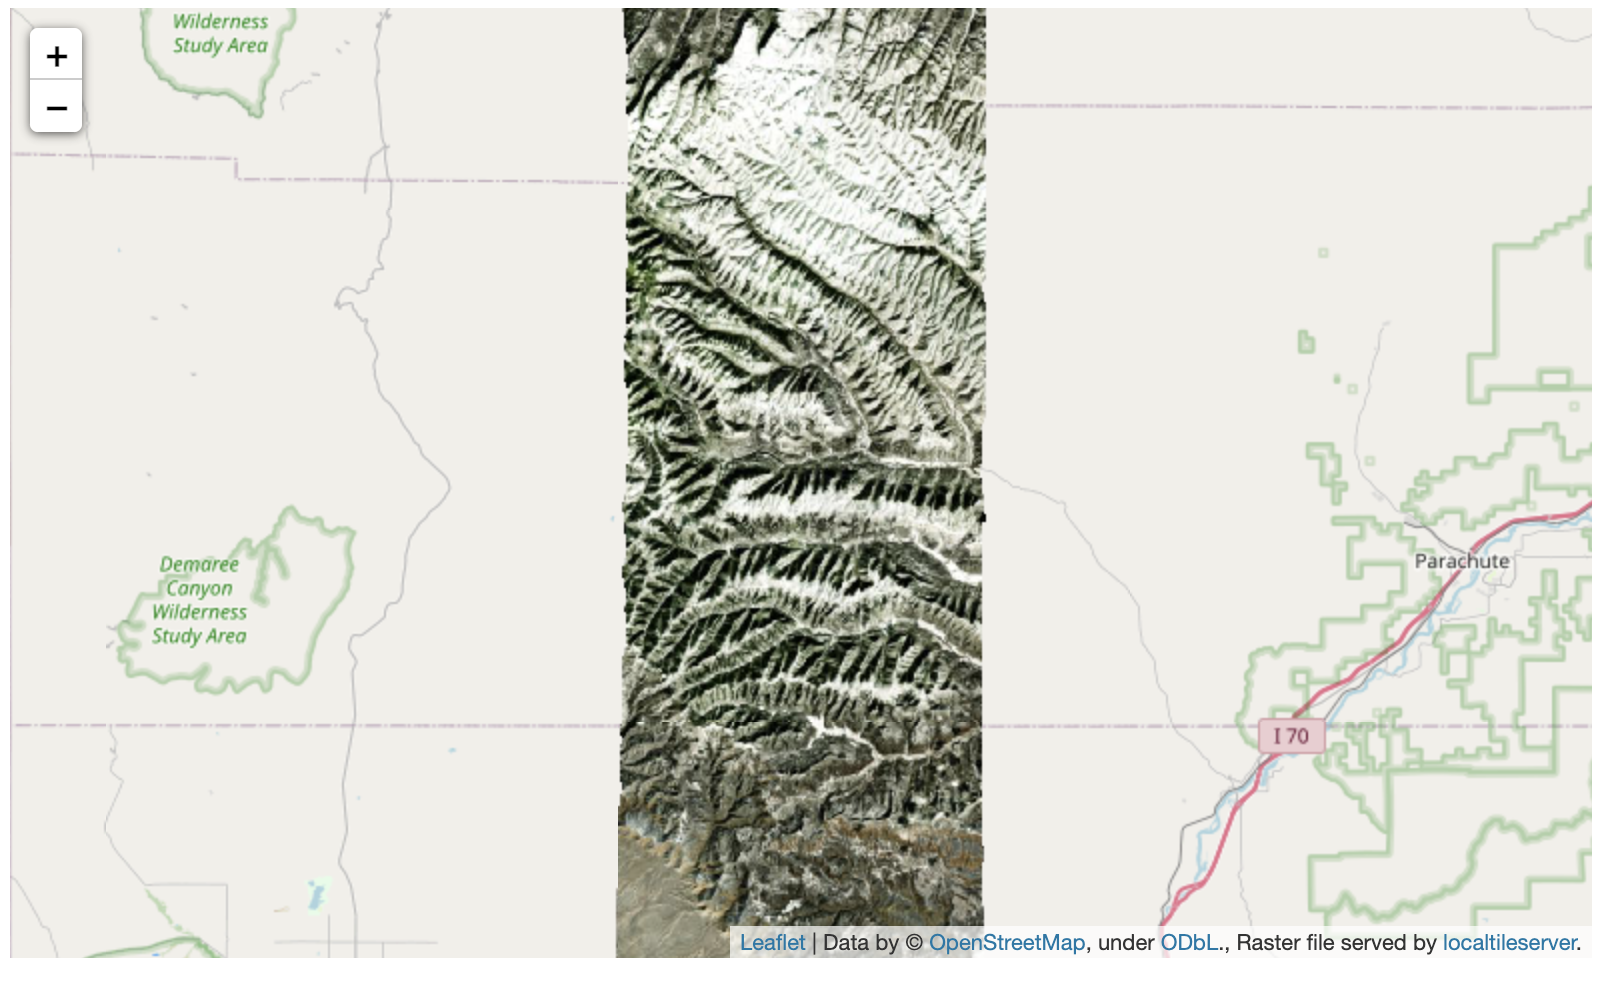
While localtileserver is intended to be used only with raster files existing on your local filesystem, there is support for URL files through GDAL's Virtual Storage Interface. Simply pass your http<s>:// or s3:// URL to the TileClient. This will work quite well for pre-tiled Cloud Optimized GeoTiffs, but I do not recommend doing this with non-tiled raster formats.

For example, the raster at the url below is ~3GiB but because it is pre-tiled, we can view tiles of the remote file very efficiently in a Jupyter notebook.

from localtileserver import get_folium_tile_layer
from localtileserver import TileClient
from folium import Map

url = 'https://opendata.digitalglobe.com/events/california-fire-2020/pre-event/2018-02-16/pine-gulch-fire20/1030010076004E00.tif'

# First, create a tile server from local raster file
tile_client = TileClient(url)

# Create folium tile layer from that server
t = get_folium_tile_layer(tile_client)

m = Map(location=tile_client.center())
m.add_child(t)
m

vsi

Note that the Virtual Storage Interface is a complex API, and TileClient currently only handles vsis3 and vsicurl. If you need a different VFS mechanism, simply create your /vsi path and pass that to TileClient.

🗺️ Example Datasets

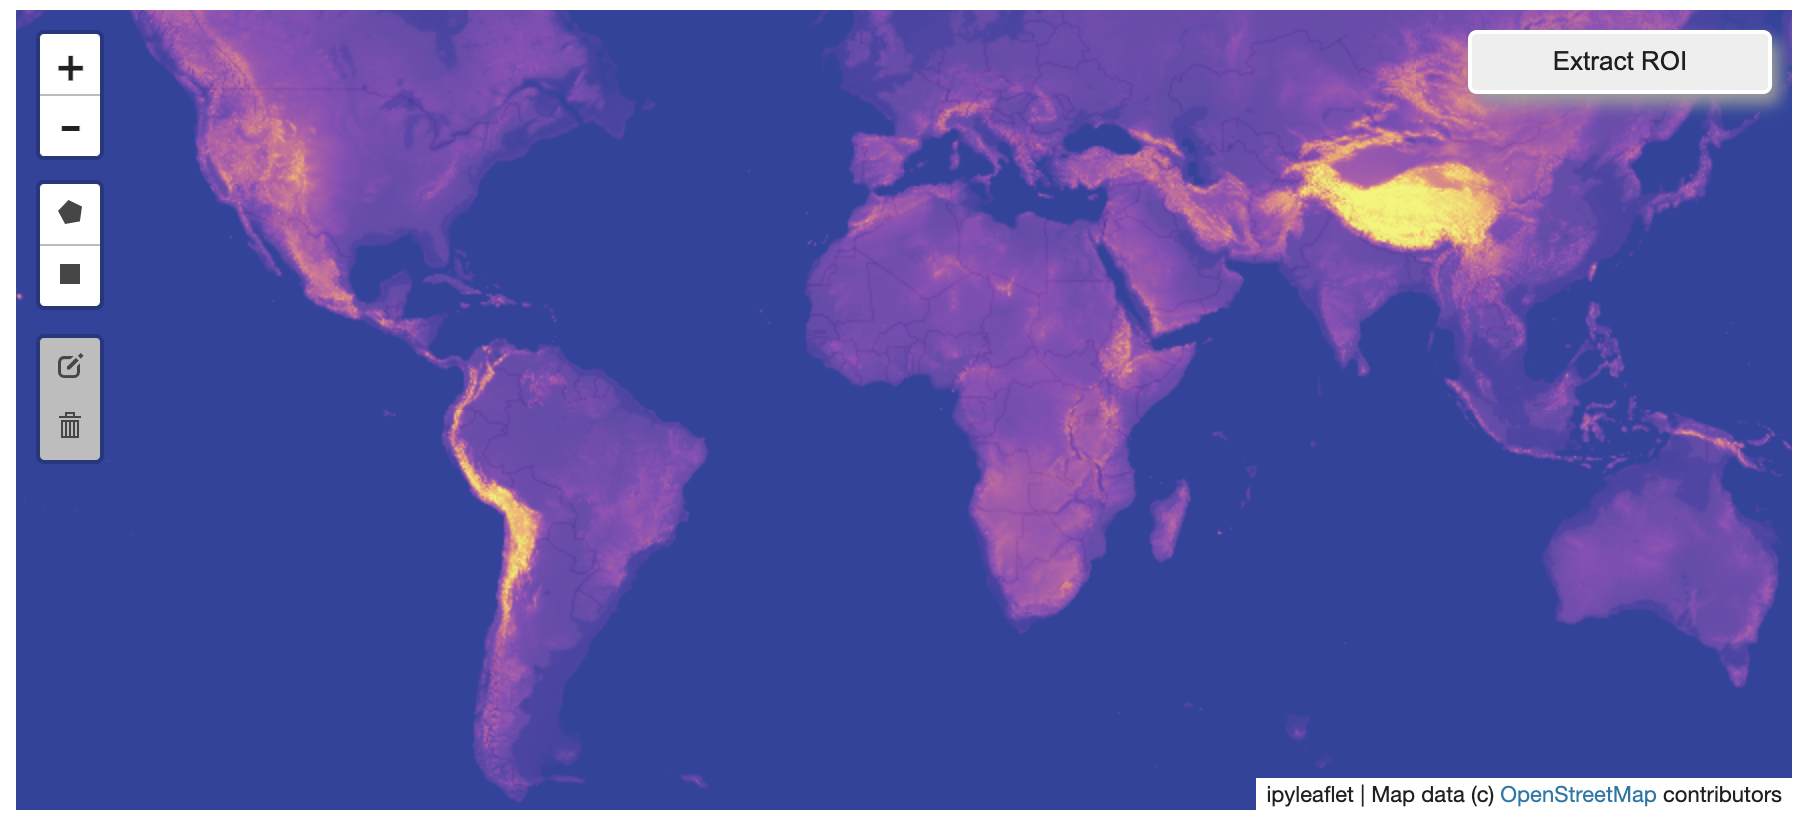
A few example datasets are included with localtileserver. A particularly useful one has global elevation data which you can use to create high resolution Digital Elevation Models (DEMs) of a local region.

from localtileserver import get_leaflet_tile_layer, get_leaflet_roi_controls, examples
from ipyleaflet import Map

# Load example tile layer from publicly available DEM source
tile_client = examples.get_elevation()

# Create ipyleaflet tile layer from that server
t = get_leaflet_tile_layer(tile_client,
                           band=1, vmin=-500, vmax=5000,
                           palette='matplotlib.Plasma_6',
                           opacity=0.75)

# Create ipyleaflet controls to extract an ROI
draw_control, roi_control = get_leaflet_roi_controls(tile_client)

m = Map(zoom=2)
m.add_layer(t)
m.add_control(draw_control)
m.add_control(roi_control)
m

elevation

Then you can follow the same routine as described above to extract an ROI.

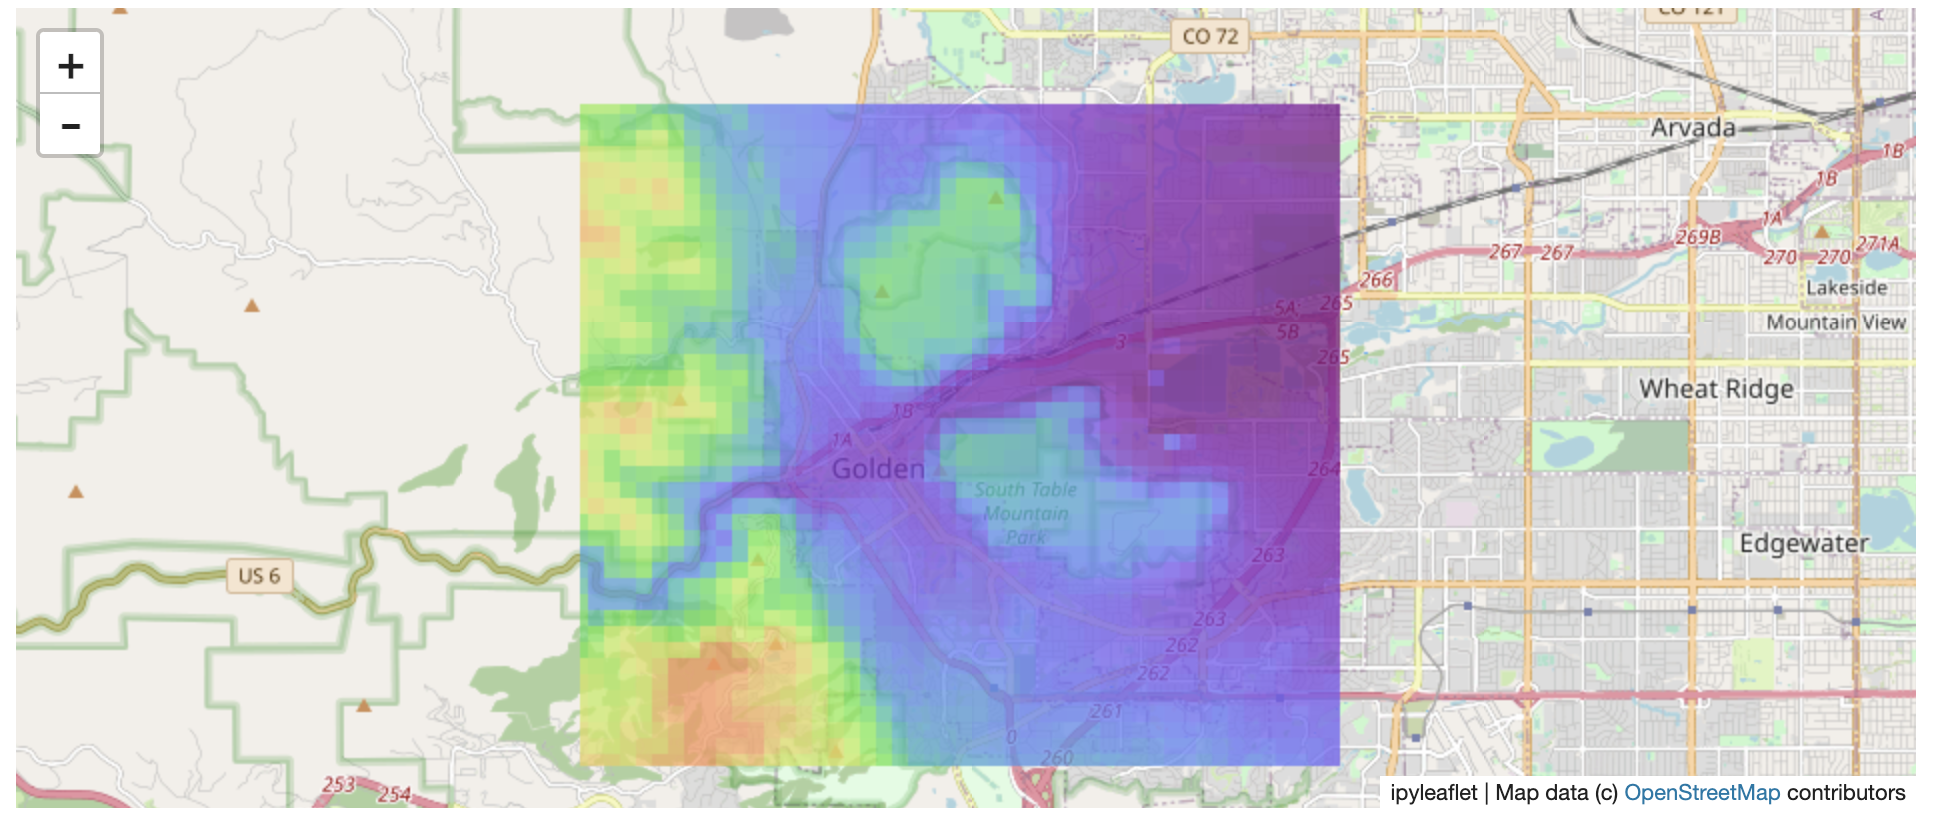
I zoomed in over Golden, Colorado and drew a polygon of the extent of the DEM I would like to create:

golden

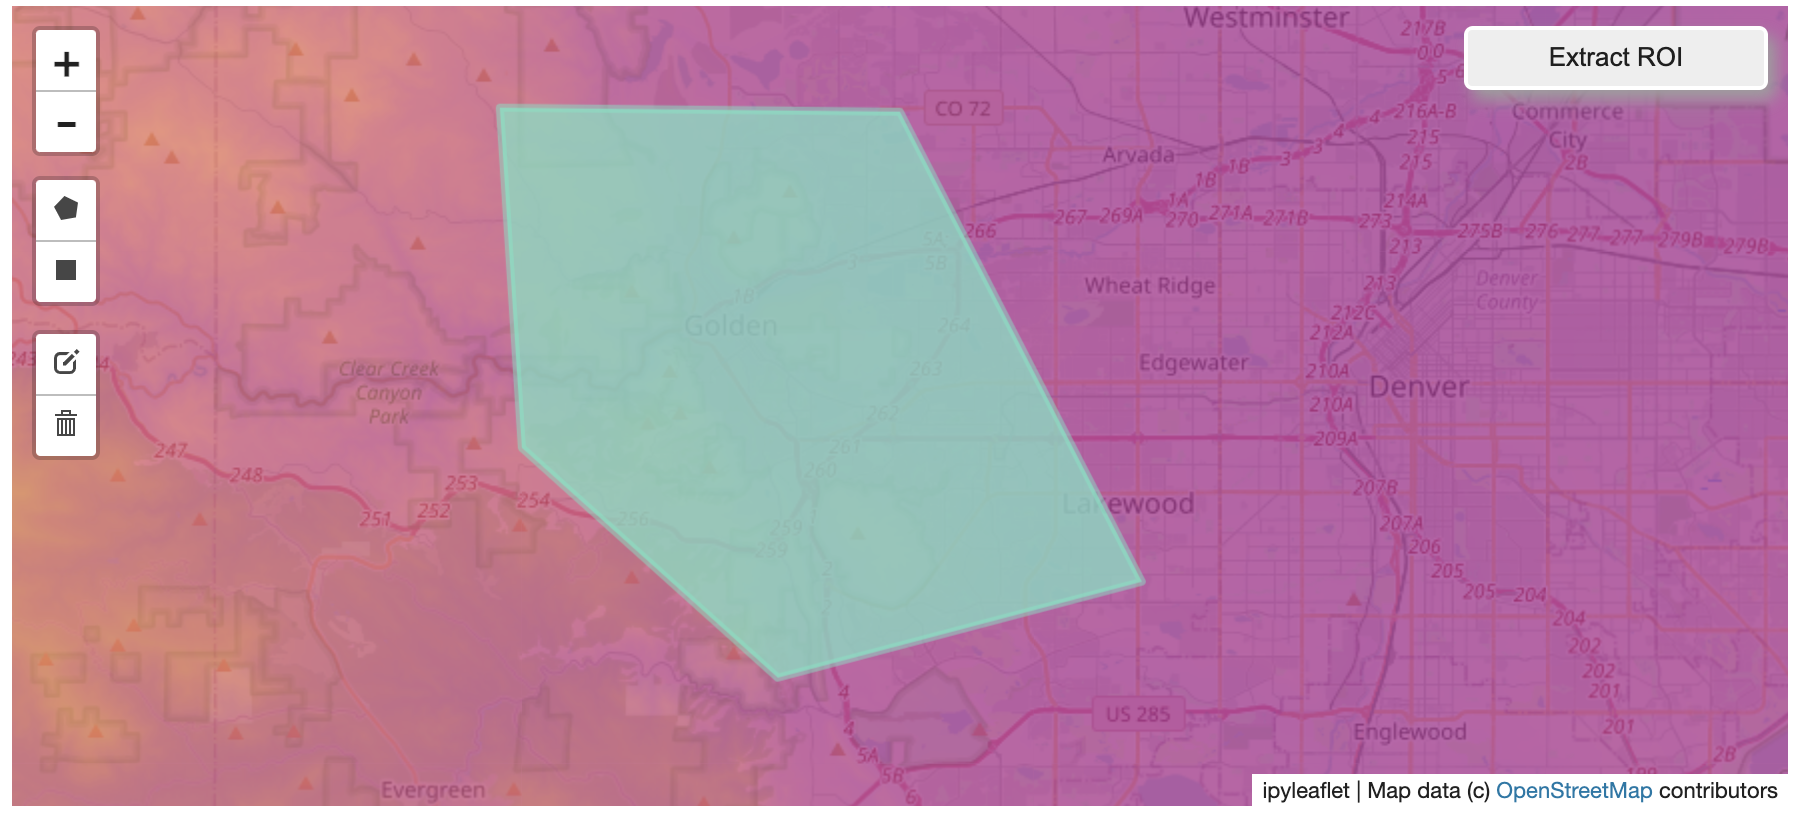
And perform the extraction:

roi_path = '...'  # Look in your working directory

r = get_leaflet_tile_layer(roi_path, band=1,
                           palette='matplotlib.Plasma_6', opacity=0.75)

m2 = Map(
        center=(39.763427033262175, -105.20614908076823),
        zoom=12,
       )
m2.add_layer(r)
m2

golden-dem

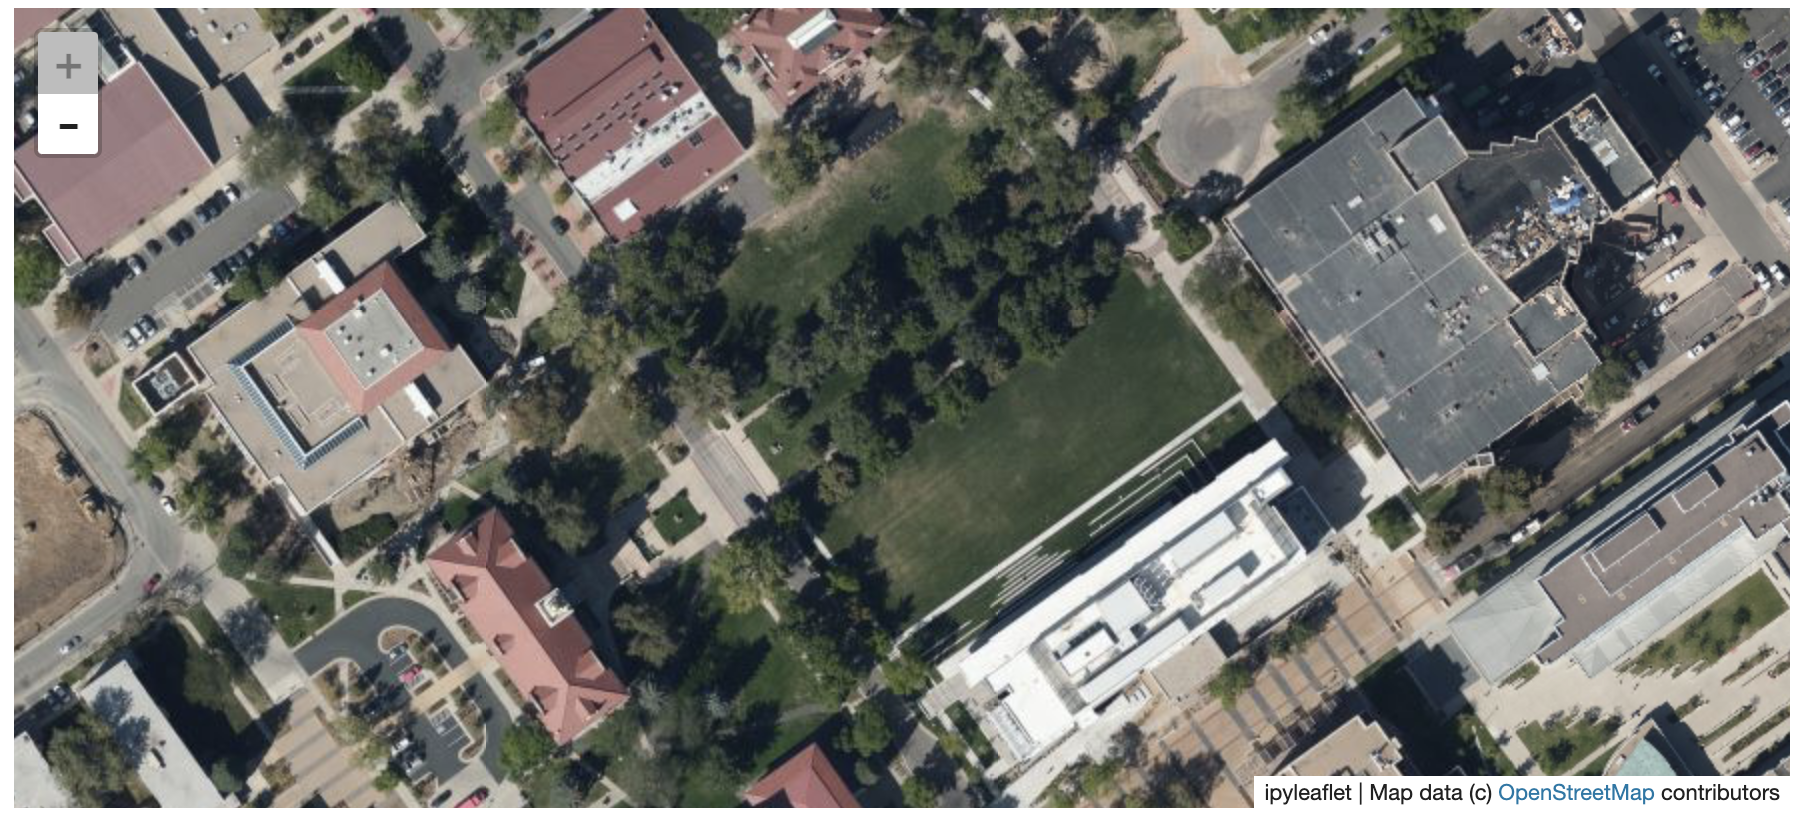
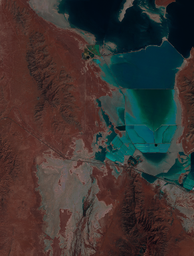
Here is another example with the Virtual Earth satellite imagery

from localtileserver import get_leaflet_tile_layer, examples
from ipyleaflet import Map

# Load example tile layer from publicly available imagery
tile_client = examples.get_virtual_earth()

# Create ipyleaflet tile layer from that server
t = get_leaflet_tile_layer(tile_client, opacity=1)

m = Map(center=(39.751343612695145, -105.22181306125279), zoom=18)
m.add_layer(t)
m

kafadar

🖥️ Local Web Application

Launch the tileserver from the commandline to use the included web application where you can view the raster and extract regions of interest.

python -m localtileserver path/to/raster.tif

cesium-viewer

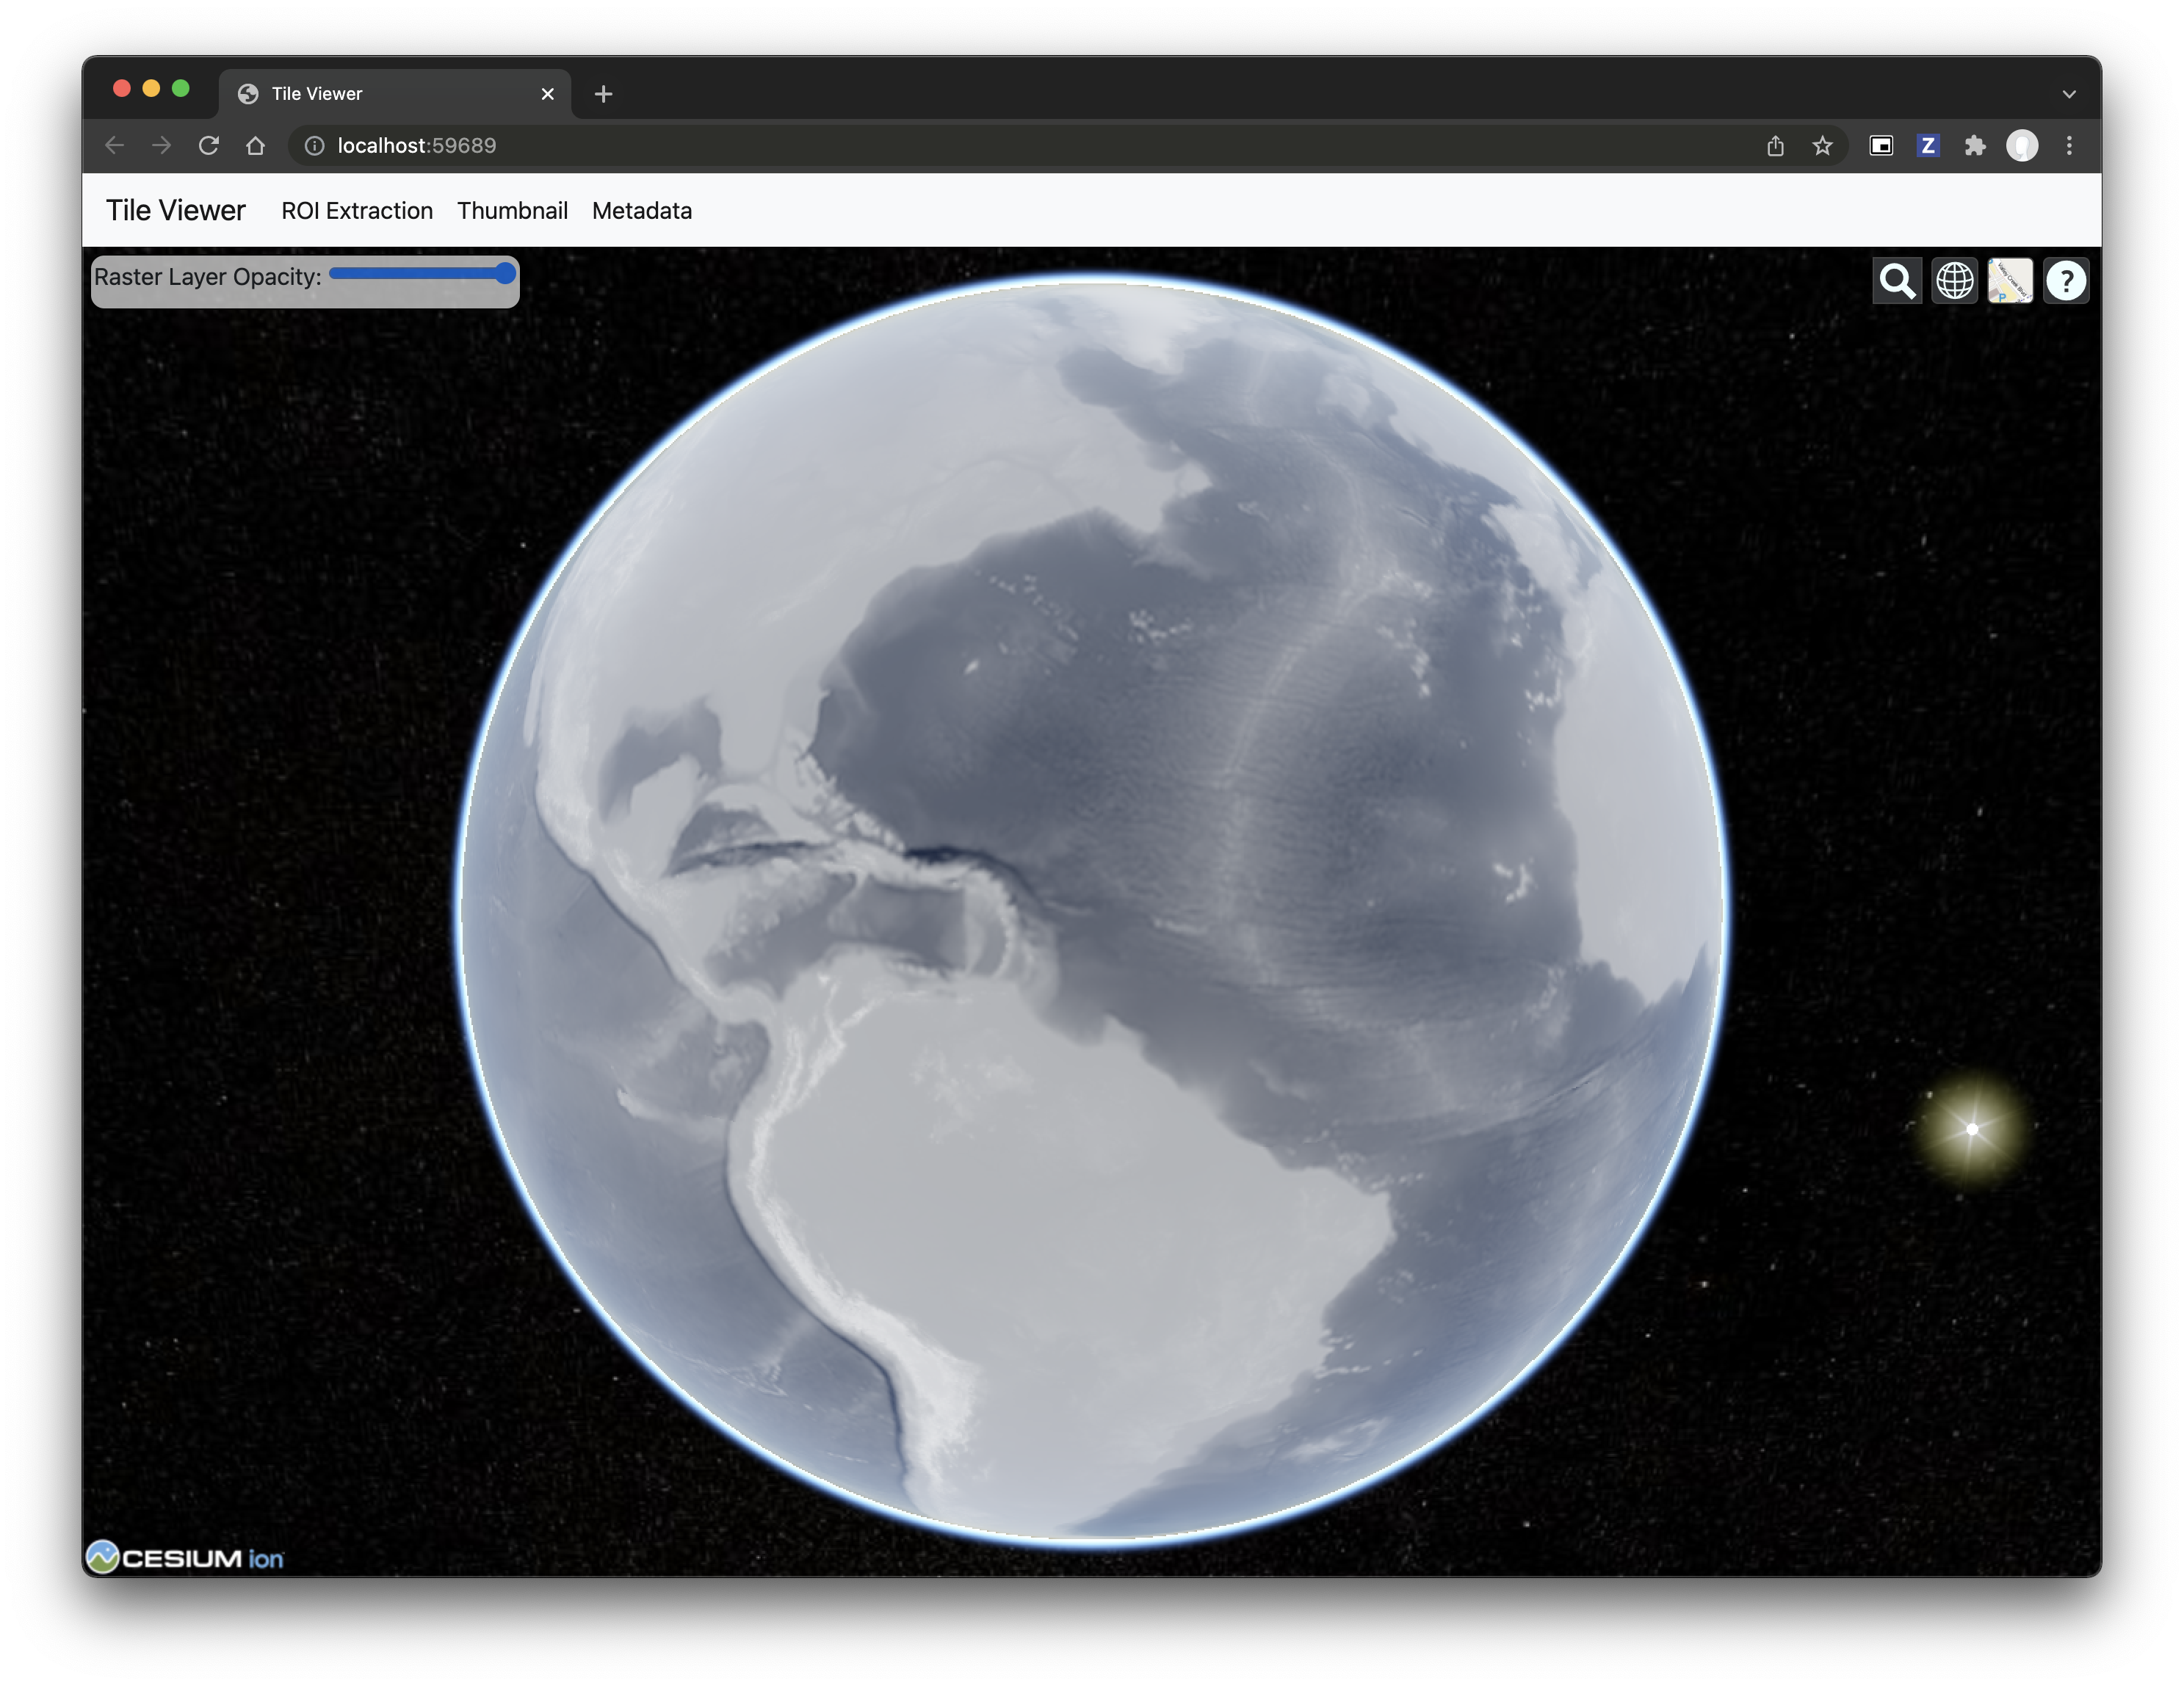
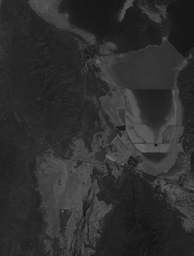
You can use the web viewer to extract regions of interest:

webviewer-roi

You can also launch the web viewer with any of the available example datasets:

python -m localtileserver dem

Available choices are:

  • dem or elevation: global elevation dataset
  • blue_marble: Blue Marble satellite imagery
  • virtual_earth: Microsoft's satellite/aerial imagery
  • arcgis: ArcGIS World Street Map
  • bahamas: Sample raster over the Bahamas

Usage Notes

  • get_leaflet_tile_layer accepts either an existing TileClient or a path from which to create a TileClient under the hood.
  • The color palette choices come from palettable.
Comments
  • Accessing localtileserver from remote Jupyter environment

    Accessing localtileserver from remote Jupyter environment

    The localtileserver works nicely locally. However, I have not been able to make it work in a cloud environment. I have tested it multiple cloud env without success, such as https://binder.pangeo.io, https://mybinder.org, https://streamlit.io/cloud and Google Colab. Below is the environment.yml I used to create the env. It would be nice to have a working env that users can launch a notebook to test localtileserver with a simple click.

    name: tileserver
    channels:
      - conda-forge
    dependencies:
      - gdal=3.2.2
      - pip
      - pip:
          - geopandas
          - leafmap
          - localtileserver
    
    opened by giswqs 12
  • AttributeError: 'Map' object has no attribute 'add_child'

    AttributeError: 'Map' object has no attribute 'add_child'

    I am trying to run the minimal example and getting this error. Maybe I am missing something big. Screen Shot 2022-03-30 at 8 14 15 AM

    Report:

    Date: Tue Mar 29 23:20:12 2022 UTC

                     OS : Linux
                 CPU(s) : 8
                Machine : x86_64
           Architecture : 64bit
                    RAM : 31.4 GiB
            Environment : Jupyter
    
      Python 3.8.10 (default, Nov 26 2021, 20:14:08)  [GCC 9.3.0]
    
        localtileserver : 0.4.4
                  flask : 2.1.0
          flask_caching : 1.10.1
            flask_restx : 0.5.1
               requests : 2.27.1
               werkzeug : 2.0.3
                  click : 8.0.4
                 scooby : 0.5.12
            large_image : 1.12.0
    large_image_source_gdal : 1.12.0
             cachetools : 5.0.0
                    PIL : 9.0.1
                 psutil : 5.9.0
                  numpy : 1.22.3
             palettable : 3.3.0
                 pyproj : 3.3.0
             osgeo.gdal : 3.0.4
             ipyleaflet : 0.15.0
              traitlets : 5.1.1
                shapely : 1.8.1.post1
                 folium : 0.12.1.post1
             matplotlib : 3.5.1
    

    opened by haseeb33 10
  • Extend to fix ImageOverlay, too?

    Extend to fix ImageOverlay, too?

    Thank you! This repo looks very promising, indeed, and gives me hope to work around https://github.com/jupyter-widgets/ipyleaflet/issues/234! Is there any chance to extend this to load ImageOverlays also from local files and/or memory, like mentioned in that issue's title? That would allow to refresh the image inside an ImageOverlay which should work with this approach, too.

    opened by deeplook 10
  • get_leaflet_tile_layer error (v0.3.13)

    get_leaflet_tile_layer error (v0.3.13)

    Both v0.3.13 and the GitHub source throws the same error when using the example. v0.3.12 works fine.

    from localtileserver import get_leaflet_tile_layer, TileClient
    from ipyleaflet import Map
    
    # First, create a tile server from local raster file
    tile_client = TileClient('~/Downloads/dem.tif')
    
    # Create ipyleaflet tile layer from that server
    t = get_leaflet_tile_layer(tile_client)
    
    # Create ipyleaflet map, add tile layer, and display
    m = Map(center=tile_client.center())
    m.add_layer(t)
    m
    

    v0.3.13 image

    v0.3.12 image

    opened by giswqs 9
  • Bokeh tile server

    Bokeh tile server

    I'd like to use localtileserver in conjunction with bokeh, though I'm not having luck. Ideally, I'd like to spin up a bokeh server, though I haven't had luck within jupyter either. I suspect this is related to 66, just not sure exactly how to point bokeh to the tiles served up by this repo.

    opened by avanetten 8
  • localtileserver with streamlit

    localtileserver with streamlit

    I created an interactive streamlit web app for visualizing local and remote COG based on localtileserver and leafmap. The web app works fine when running locally. However, when deployed to Streamlit Cloud, the tile layer won't show up. I turned on the debug mode and found that the app in streamlit cloud is missing GET /tiles/. See the screenshots and video demo below. Any advice? Thanks.

    Web App: https://share.streamlit.io/giswqs/streamlit-geospatial/app.py?page=Visualize+Raster+Data Source code: https://github.com/giswqs/streamlit-geospatial/blob/master/apps/raster.py

    The app running on Streamlit Cloud (missing GET /tiles/ ) - layer not shown up image

    The app running locally (with GET /tiles/ ) - layer shown up correctly image

    https://user-images.githubusercontent.com/5016453/143720329-fa20b1f8-3f1c-4cb0-9460-735d9d23da19.mp4

    opened by giswqs 8
  • Packaging with pyinstaller

    Packaging with pyinstaller

    Hello, I am using the localetileserver, and it is working but when I try to convert my py to exe the program shows me this error.

    large_image.exceptions.TileSourceError: No available tilesource for C:\Users\iiMox\AppData\Local\Temp_MEI50602\NE1_LR_LC_SR_W_DR.tif

    opened by iiMox 7
  • Deploy on Heroku

    Deploy on Heroku

    Its live at https://localtileserver-demo.herokuapp.com

    I'm using a free dyno so if this gets any traffic at all, it will probably crash

    The changes in this PR make it so that any URL file can be passed as a query param at that URL for viewing. For example:

    https://localtileserver-demo.herokuapp.com?filename=https://opendata.digitalglobe.com/events/california-fire-2020/pre-event/2018-02-16/pine-gulch-fire20/1030010076004E00.tif

    And another file hosted on S3: https://localtileserver-demo.herokuapp.com/?filename=s3://sentinel-cogs/sentinel-s2-l2a-cogs/2020/S2A_31QHU_20200714_0_L2A/B01.tif

    opened by banesullivan 7
  • Multiband support and MPL colormaps

    Multiband support and MPL colormaps

    Resolve #22

    This all feels a bit hacky, but it works. @giswqs, would you please review/test.

    Here is an example

    from localtileserver import get_leaflet_tile_layer, TileClient
    from ipyleaflet import Map
    
    # First, create a tile server from local raster file
    tile_client = TileClient('./landsat.tif')
    
    # Create ipyleaflet tile layer from that server
    t = get_leaflet_tile_layer(tile_client, band=[4, 3, 2])
    
    # Create ipyleaflet map, add tile layer, and display
    m = Map(center=tile_client.center())
    m.add_layer(t)
    m
    
    Screen Shot 2021-12-05 at 1 12 18 PM 1

    or like the screenshots in #22:

    # Create ipyleaflet tile layer from that server
    t = get_leaflet_tile_layer(tile_client, band=[5, 4, 3])
    
    # Create ipyleaflet map, add tile layer, and display
    m = Map(center=tile_client.center())
    m.add_layer(t)
    m
    
    Screen Shot 2021-12-05 at 1 17 28 PM

    To do:

    • [x] Update type hints and documentation
    • [x] Add example to README
    • [ ] User test
    opened by banesullivan 7
  • Add package to conda-forge

    Add package to conda-forge

    Thank you for developing this nice package. I just tested it on my computer, and it works like a charm! I plan to incorporate the package into geemap and leafmap. Would you consider making the package available on conda-forge? Thanks.

    opened by giswqs 6
  • Update flake8 requirement from <5.0.0 to <6.0.0

    Update flake8 requirement from <5.0.0 to <6.0.0

    Updates the requirements on flake8 to permit the latest version.

    Commits
    • 70c0b3d Release 5.0.2
    • 5e69ba9 Merge pull request #1642 from PyCQA/no-home
    • 8b51ee4 skip skipping home if home does not exist
    • 446b18d Merge pull request #1641 from PyCQA/entry-points-not-pickleable
    • b70d7a2 work around un-pickleabiliy of EntryPoint in 3.8.0
    • 91a7fa9 fix order of release notes
    • 405cfe0 Release 5.0.1
    • d20bb97 Merge pull request #1631 from PyCQA/dupe-sys-path
    • fce93b9 prevent duplicate plugin discovery on misconfigured pythons
    • 3f4872a Merge pull request #1628 from mxr/patch-1
    • Additional commits viewable in compare view

    Dependabot will resolve any conflicts with this PR as long as you don't alter it yourself. You can also trigger a rebase manually by commenting @dependabot rebase.


    Dependabot commands and options

    You can trigger Dependabot actions by commenting on this PR:

    • @dependabot rebase will rebase this PR
    • @dependabot recreate will recreate this PR, overwriting any edits that have been made to it
    • @dependabot merge will merge this PR after your CI passes on it
    • @dependabot squash and merge will squash and merge this PR after your CI passes on it
    • @dependabot cancel merge will cancel a previously requested merge and block automerging
    • @dependabot reopen will reopen this PR if it is closed
    • @dependabot close will close this PR and stop Dependabot recreating it. You can achieve the same result by closing it manually
    • @dependabot ignore this major version will close this PR and stop Dependabot creating any more for this major version (unless you reopen the PR or upgrade to it yourself)
    • @dependabot ignore this minor version will close this PR and stop Dependabot creating any more for this minor version (unless you reopen the PR or upgrade to it yourself)
    • @dependabot ignore this dependency will close this PR and stop Dependabot creating any more for this dependency (unless you reopen the PR or upgrade to it yourself)
    dependencies python 
    opened by dependabot[bot] 5
  • Bump sphinx from 5.3.0 to 6.0.0

    Bump sphinx from 5.3.0 to 6.0.0

    Bumps sphinx from 5.3.0 to 6.0.0.

    Release notes

    Sourced from sphinx's releases.

    v6.0.0

    Changelog: https://www.sphinx-doc.org/en/master/changes.html

    v6.0.0b2

    Changelog: https://www.sphinx-doc.org/en/master/changes.html

    v6.0.0b1

    Changelog: https://www.sphinx-doc.org/en/master/changes.html

    Changelog

    Sourced from sphinx's changelog.

    Release 6.0.0 (released Dec 29, 2022)

    Dependencies

    • #10468: Drop Python 3.6 support
    • #10470: Drop Python 3.7, Docutils 0.14, Docutils 0.15, Docutils 0.16, and Docutils 0.17 support. Patch by Adam Turner

    Incompatible changes

    • #7405: Removed the jQuery and underscore.js JavaScript frameworks.

      These frameworks are no longer be automatically injected into themes from Sphinx 6.0. If you develop a theme or extension that uses the jQuery, $, or $u global objects, you need to update your JavaScript to modern standards, or use the mitigation below.

      The first option is to use the sphinxcontrib.jquery_ extension, which has been developed by the Sphinx team and contributors. To use this, add sphinxcontrib.jquery to the extensions list in conf.py, or call app.setup_extension("sphinxcontrib.jquery") if you develop a Sphinx theme or extension.

      The second option is to manually ensure that the frameworks are present. To re-add jQuery and underscore.js, you will need to copy jquery.js and underscore.js from the Sphinx repository_ to your static directory, and add the following to your layout.html:

      .. code-block:: html+jinja

      {%- block scripts %} {{ super() }} {%- endblock %}

      .. _sphinxcontrib.jquery: https://github.com/sphinx-contrib/jquery/

      Patch by Adam Turner.

    • #10471, #10565: Removed deprecated APIs scheduled for removal in Sphinx 6.0. See :ref:dev-deprecated-apis for details. Patch by Adam Turner.

    • #10901: C Domain: Remove support for parsing pre-v3 style type directives and roles. Also remove associated configuration variables c_allow_pre_v3 and c_warn_on_allowed_pre_v3. Patch by Adam Turner.

    Features added

    ... (truncated)

    Commits

    Dependabot compatibility score

    Dependabot will resolve any conflicts with this PR as long as you don't alter it yourself. You can also trigger a rebase manually by commenting @dependabot rebase.


    Dependabot commands and options

    You can trigger Dependabot actions by commenting on this PR:

    • @dependabot rebase will rebase this PR
    • @dependabot recreate will recreate this PR, overwriting any edits that have been made to it
    • @dependabot merge will merge this PR after your CI passes on it
    • @dependabot squash and merge will squash and merge this PR after your CI passes on it
    • @dependabot cancel merge will cancel a previously requested merge and block automerging
    • @dependabot reopen will reopen this PR if it is closed
    • @dependabot close will close this PR and stop Dependabot recreating it. You can achieve the same result by closing it manually
    • @dependabot ignore this major version will close this PR and stop Dependabot creating any more for this major version (unless you reopen the PR or upgrade to it yourself)
    • @dependabot ignore this minor version will close this PR and stop Dependabot creating any more for this minor version (unless you reopen the PR or upgrade to it yourself)
    • @dependabot ignore this dependency will close this PR and stop Dependabot creating any more for this dependency (unless you reopen the PR or upgrade to it yourself)
    dependencies python 
    opened by dependabot[bot] 1
  • Bump python from 3.10.7-slim to 3.11.1-slim

    Bump python from 3.10.7-slim to 3.11.1-slim

    Bumps python from 3.10.7-slim to 3.11.1-slim.

    Dependabot compatibility score

    Dependabot will resolve any conflicts with this PR as long as you don't alter it yourself. You can also trigger a rebase manually by commenting @dependabot rebase.


    Dependabot commands and options

    You can trigger Dependabot actions by commenting on this PR:

    • @dependabot rebase will rebase this PR
    • @dependabot recreate will recreate this PR, overwriting any edits that have been made to it
    • @dependabot merge will merge this PR after your CI passes on it
    • @dependabot squash and merge will squash and merge this PR after your CI passes on it
    • @dependabot cancel merge will cancel a previously requested merge and block automerging
    • @dependabot reopen will reopen this PR if it is closed
    • @dependabot close will close this PR and stop Dependabot recreating it. You can achieve the same result by closing it manually
    • @dependabot ignore this major version will close this PR and stop Dependabot creating any more for this major version (unless you reopen the PR or upgrade to it yourself)
    • @dependabot ignore this minor version will close this PR and stop Dependabot creating any more for this minor version (unless you reopen the PR or upgrade to it yourself)
    • @dependabot ignore this dependency will close this PR and stop Dependabot creating any more for this dependency (unless you reopen the PR or upgrade to it yourself)
    dependencies docker 
    opened by dependabot[bot] 1
  • Bump jupyter/base-notebook from python-3.9.12 to python-3.10.8

    Bump jupyter/base-notebook from python-3.9.12 to python-3.10.8

    Bumps jupyter/base-notebook from python-3.9.12 to python-3.10.8.

    Dependabot compatibility score

    Dependabot will resolve any conflicts with this PR as long as you don't alter it yourself. You can also trigger a rebase manually by commenting @dependabot rebase.


    Dependabot commands and options

    You can trigger Dependabot actions by commenting on this PR:

    • @dependabot rebase will rebase this PR
    • @dependabot recreate will recreate this PR, overwriting any edits that have been made to it
    • @dependabot merge will merge this PR after your CI passes on it
    • @dependabot squash and merge will squash and merge this PR after your CI passes on it
    • @dependabot cancel merge will cancel a previously requested merge and block automerging
    • @dependabot reopen will reopen this PR if it is closed
    • @dependabot close will close this PR and stop Dependabot recreating it. You can achieve the same result by closing it manually
    • @dependabot ignore this major version will close this PR and stop Dependabot creating any more for this major version (unless you reopen the PR or upgrade to it yourself)
    • @dependabot ignore this minor version will close this PR and stop Dependabot creating any more for this minor version (unless you reopen the PR or upgrade to it yourself)
    • @dependabot ignore this dependency will close this PR and stop Dependabot creating any more for this dependency (unless you reopen the PR or upgrade to it yourself)
    dependencies docker 
    opened by dependabot[bot] 0
  • Support for Amazon SageMaker Studio Lab

    Support for Amazon SageMaker Studio Lab

    Amazon SageMaker Studio is a free cloud computing platform, similar to Binder but users can install packages and save files permanently. It seems localtileserver is not working on SageMaker, even after running the following code. Any advice?

    import os
    os.environ["LOCALTILESERVER_CLIENT_PREFIX"] = "proxy/{port}"
    

    image

    image

    image

    image

    opened by giswqs 1
  • Raster image stretch e.g. min max stretching

    Raster image stretch e.g. min max stretching

    Hi, has there been any work or examples on stretching the rasters when used with localtileserver.get_leaflet_tile_layer? Working with uint16 raster at the time and imagery is extremely dark. I have seen this example using the ee library, https://github.com/giswqs/earthengine-py-notebooks/blob/master/Visualization/image_stretch.py, but I have not seen any available args in order to work on stretching the image (https://girder.github.io/large_image/tilesource_options.html#style). Thanks!

    enhancement 
    opened by jordancaraballo 10
  • Very slow on Windows

    Very slow on Windows

    I noticed that localtileserver is very slow on Windows. It took ~13 seconds to generate tiles for thisvery small GeoTIFF (14 MB). It used to be very fast on Linux. I am not sure what causes the issue.

    Animation

    from localtileserver import get_leaflet_tile_layer, TileClient
    from ipyleaflet import Map
    
    # First, create a tile server from local raster file
    client = TileClient('srtm90.tif')
    
    # Create ipyleaflet tile layer from that server
    t = get_leaflet_tile_layer(client)
    
    m = Map(center=client.center(), zoom=client.default_zoom)
    m.add_layer(t)
    m
    

    env

    --------------------------------------------------------------------------------
      Date: Wed Aug 03 16:17:46 2022 Eastern Daylight Time
    
                         OS : Windows
                     CPU(s) : 16
                    Machine : AMD64
               Architecture : 64bit
                        RAM : 31.7 GiB
                Environment : Jupyter
    
      Python 3.10.4 | packaged by conda-forge | (main, Mar 30 2022, 08:38:02) [MSC
      v.1916 64 bit (AMD64)]
    
            localtileserver : 0.5.11
                      flask : 2.1.3
              flask_caching : 1.10.1
                 flask_cors : 3.0.10
                flask_restx : 0.5.1
                   requests : 2.28.1
                   werkzeug : 2.1.2
                      click : 8.1.3
              server_thread : 0.2.0
                     scooby : 0.5.12
                large_image : 1.15.1
    large_image_source_gdal : 1.15.1
                 cachetools : 4.2.4
                        PIL : 9.2.0
                     psutil : 5.9.1
                      numpy : 1.23.1
                 palettable : 3.3.0
                     pyproj : 3.3.1
                 osgeo.gdal : 3.4.2
                 ipyleaflet : 0.17.0
                 jupyterlab : 3.4.4
                  traitlets : 5.3.0
                    shapely : 1.8.2
                     folium : 0.12.1.post1
                 matplotlib : 3.5.2
    --------------------------------------------------------------------------------
    
    bug 
    opened by giswqs 6
Releases(0.5.5)
  • 0.5.5(Apr 29, 2022)

    New features:

    • Add COG validate helper (see #80)
    • Enable * CORS by user choice
    • Add is_geospatial property to TileClient
    • Add default_zoom property to TileClient to determine starting zoom on map
    • Handle tile serving in pixel coordinates for non-geospatial images

    Niceties:

    • Handle large_image source as input to TileClient
    • Add _ipython_display_ to TileClient to quickly display a map in Jupyter
    • Add _repr_png_ to TileClient to quickly show a thumbnail in Qt IPython
    • Add URL form field to web app

    Maintenance:

    • Maintenance of Docker images
    • Internal refactoring to utilize new server-thread package (see #79)
    • Documentation and examples improvements
    Source code(tar.gz)
    Source code(zip)
  • 0.5.3(Apr 18, 2022)

    • Style parameters can now be included as a JSON blob in the request body following the format specified by large-image or as a dict in the syle parameter in the Python client.
    • cmap alias for palette in Python client (see #71)
    • Better error handling
    • Handle Dropbox URLs
    • New save_new_raster helper method
    • Bug fixes, cleanup, and other internal maintenance (see diff)

    This release adds support for rasterio datasets so that users can easily visualize their data when working with rasterio:

    import rasterio
    from ipyleaflet import Map
    from localtileserver import TileClient, get_leaflet_tile_layer
    
    # Open raster with rasterio
    src = rasterio.open('path/to/geo.tif')
    
    # Pass rasterio source to localtileserver
    client = TileClient(src)
    
    t = get_leaflet_tile_layer(client)
    
    m = Map(center=client.center(), zoom=8)
    m.add_layer(t)
    m
    
    Source code(tar.gz)
    Source code(zip)
  • 0.4.2(Feb 6, 2022)

    This release adds support for using localtileserver in remote Jupyter environments (e.g., MyBinder or JupyterHub) through jupyter-server-proxy. Included in this release is a new Docker image on GitHub's package registry for using localtileserver in Jupyter.

    docker pull ghcr.io/banesullivan/localtileserver-jupyter:latest
    docker run -p 8888:8888 ghcr.io/banesullivan/localtileserver-jupyter:latest
    

    To configure this in your own set up, you must set the following environment variables

    • LOCALTILESERVER_CLIENT_PREFIX='proxy/{port}' - Same for everyone using jupyter-server-proxy
    • Optional:
      • LOCALTILESERVER_CLIENT_HOST=127.0.0.1 - The host on which you launch Jupyter (the URL/domain of the Jupyter instance if using MyBinder or JupyterHub)
      • LOCALTILESERVER_CLIENT_PORT=8888 - The port on which you launch Jupyter (leave blank if using MyBinder or JupyterHub)

    There is a demo in https://github.com/banesullivan/localtileserver-demo that shows how this will work on MyBinder by setting the following at run-time:

    # Set host forwarding for MyBinder
    import os
    os.environ['LOCALTILESERVER_CLIENT_PREFIX'] = f"{os.environ['JUPYTERHUB_SERVICE_PREFIX'].lstrip('/')}/proxy/{{port}}"
    

    Resolves #29, #66, and https://github.com/banesullivan/localtileserver-demo/issues/1

    Source code(tar.gz)
    Source code(zip)
  • 0.4.0(Jan 12, 2022)

    This release has one breaking change (breaking for a small minority of users) where the API endpoints were renamed to have the api/ prefix where applicable (see #51). Other notes:

    • Document style parameters for Thumbnail endpoint (see 7e27db045b7798ba191f0b4350928eda17625c15)
    • Support custom, user-defined palettes (see #54)
    • Cesium Split Viewer (see #47 and https://github.com/banesullivan/localtileserver/discussions/53)
    • Cesium terrain model is now disabled by default (see fe1c2103aa13cbdc49eb5ec2e785e3a35b8907b8)

    Standalone Docker Image - #57

    Now you can easily pull a docker image for the latest release or for a specific Pull Request in the repository. Check out the tags for https://github.com/banesullivan/localtileserver/pkgs/container/localtileserver

    This is particularly useful if you do not want to install GDAL on your system or want a dedicated service for tile serving.

    To use the docker image:

    docker pull ghcr.io/banesullivan/localtileserver:latest
    docker run -p 8000:8000 ghcr.io/banesullivan/localtileserver:latest
    

    Then visit http://0.0.0.0:8000 in your browser. You can pass the ?filename= argument in the URL params to access any URL/S3 file.

    Note that you can mount your file system to access files locally. For example, I mount my Desktop by:

    docker run -p 8000:8000 -v /Users/bane/Desktop/:/data/ ghcr.io/banesullivan/localtileserver:latest
    

    Then I can add the ?filename= parameter to the URL to access the file TC_NG_SFBay_US_Geo.tif file on my desktop. Since this is mounted under /data/ in the container, you must build the path as /data/TC_NG_SFBay_US_Geo.tif, such that the URL would be http://0.0.0.0:8000/?filename=/data/TC_NG_SFBay_US_Geo.tif (or http://0.0.0.0:8000/?filename=%2Fdata%2FTC_NG_SFBay_US_Geo.tif)

    Source code(tar.gz)
    Source code(zip)
  • 0.3.13(Dec 27, 2021)

    Bye-bye, Python 3.6! 👋🏻

    This release introduces an override to ipyleaflet.TileLayer that constrains the region of requested tiles, per jupyter-widgets/ipyleaflet#888. This significantly reduces the load on the tile server when viewing tiles in an ipyleaflet.Map

    This change required dropping Python 3.6 and was good timing since Python 3.6's Security Support ended Dec 23, 2021 (4 days ago) (ref https://endoflife.date/python). Since conda-forge hasn't been building on Python 3.6 for some time, I'm hoping there is minimal impact here

    Source code(tar.gz)
    Source code(zip)
  • 0.3.12(Dec 20, 2021)

    The last few tags have been full of useful/nice to have features and clean up. The follow is a recap

    • Multi-band support: create composite images from selected bands
    • Automatically opens web browser when launching from command line
    • Under the hood improvements and abstraction of the underlying flask app to a Blueprint
    • Major UI improvements with color mapping options
    • Support user provided CesiumIon tokens
    • Support memcached
    • Better handle bad filenames/URLs with 404 page
    • Improvements to CesiumJS and GeoJS tile viewers
    • Google Analytics support
    • New pixel endpoint
    • New Histogram endpoint
    • New tile sources endpoint
    • New colormaps listing endpoint

    Swagger API Docs

    There is now an /swagger/ view with full API documentation:

    | List | Tiles | |---|---| | Screen Shot 2021-12-20 at 12 41 12 AM | Screen Shot 2021-12-20 at 12 41 27 AM |

    This introduced a new flask-restx dependency.

    Docker Image

    You can now pull a pre-built docker image from the packages of this repository

    docker pull ghcr.io/banesullivan/localtileserver/localtileserver:latest
    

    To run:

    docker run --rm -it -p 8000:8000 ghcr.io/banesullivan/localtileserver/localtileserver
    

    If you want to serve/visualize tiles from files on your local system, simply mount the directory:

    docker run --rm -it -p 8000:8000 -v /path/to/mount/:/data ghcr.io/banesullivan/localtileserver/localtileserver
    

    Then be sure to put the ?filename=/data/... in the URL params

    Source code(tar.gz)
    Source code(zip)
  • 0.3.5(Dec 6, 2021)

    This release adds support for three new features:

    • Choose which bands to use for RGB channels when tile serving
    • Generate thumbnails with the same styling parameters as tile serving
    • Use any Matplotlib colormap as a palette choice

    Example

    There is a new example in the README to demonstrate RGB channel selection:

    from localtileserver import get_leaflet_tile_layer, TileClient
    from ipyleaflet import Map, ScaleControl, FullScreenControl, SplitMapControl
    
    # First, create a tile server from local raster file
    tile_client = TileClient('landsat.tif')
    
    # Create 2 tile layers from same raster viewing different bands
    l = get_leaflet_tile_layer(tile_client, band=[7, 5, 4])
    r = get_leaflet_tile_layer(tile_client, band=[5, 3, 2])
    
    # Make the ipyleaflet map
    m = Map(center=tile_client.center(), zoom=12)
    control = SplitMapControl(left_layer=l, right_layer=r)
    m.add_control(control)
    m.add_control(ScaleControl(position='bottomleft'))
    m.add_control(FullScreenControl())
    m
    
    ipyleaflet-multi-bands

    Thumbnails

    and you can also generate styled thumbnails with

    tile_client.thumbnail(band=[5, 3, 2], output_path='thumbnail_styled.png')
    

    thumbnail

    as opposed to the default channels:

    tile_client.thumbnail(output_path='thumbnail_default.png')
    

    thumbnail

    Matplotlib Colormaps

    and you can plot any single band with a matplotlib colormap by:

    l = get_leaflet_tile_layer(tile_client, band=7, palette='rainbow')
    
    
    m = Map(center=tile_client.center(), zoom=10)
    m.add_layer(l)
    m
    
    Screen Shot 2021-12-05 at 6 15 32 PM 1 Source code(tar.gz)
    Source code(zip)
  • 0.3.4(Nov 27, 2021)

    This adds support for serving tiles from remote raster files through GDAL's Virtual Storage Interface. Simply pass your http<s>:// or s3:// URL to the TileClient. This will work quite well for pre-tiled Cloud Optimized GeoTiffs, but I do not recommend doing this with non-tiled raster formats.

    Further, this release contains a few internal changes that dramatically improve the performance of the underlying tile server. Users can control whether the server is run in a multi-threaded or multi-process manner.

    from localtileserver import get_folium_tile_layer
    from localtileserver import TileClient
    from folium import Map
    
    # This is a ~3GiB image
    url = 'https://opendata.digitalglobe.com/events/california-fire-2020/pre-event/2018-02-16/pine-gulch-fire20/1030010076004E00.tif'
    
    # First, create a tile server from local raster file
    tile_client = TileClient(url)
    
    # Create folium tile layer from that server
    t = get_folium_tile_layer(tile_client)
    
    m = Map(location=tile_client.center())
    m.add_child(t)
    m
    
    vsi-raster Source code(tar.gz)
    Source code(zip)
  • 0.3.2(Nov 26, 2021)

    Now you can easily create tile layers for viewing with Folium!

    from localtileserver import get_folium_tile_layer
    from localtileserver import TileClient
    from folium import Map
    
    # First, create a tile server from local raster file
    tile_client = TileClient('~/Desktop/TC_NG_SFBay_US_Geo.tif')
    
    # Create folium tile layer from that server
    t = get_folium_tile_layer(tile_client)
    
    m = Map(location=tile_client.center())
    m.add_child(t)
    m
    

    https://user-images.githubusercontent.com/22067021/143659402-f1ee453c-4c56-4908-a7d7-1e34c83a3edf.mov

    Source code(tar.gz)
    Source code(zip)
  • 0.3.0(Nov 25, 2021)

  • 0.2.3(Nov 24, 2021)

    Now included are some prebaked UI controls for ipyleaflet that let you easily extract ROIs. Take a look at the example in the README.

    https://user-images.githubusercontent.com/22067021/143311931-e19647d0-74bc-490a-821c-8046fc9c5dfa.mov

    Source code(tar.gz)
    Source code(zip)
  • 0.2.2(Nov 24, 2021)

    The default viewer in the included web app now uses CesiumJS!

    https://user-images.githubusercontent.com/22067021/143178656-12e6e0fa-b601-4746-aae9-726d6f109fee.mov

    Source code(tar.gz)
    Source code(zip)
Owner
Bane Sullivan
Research software engineer. Interested in all things earth science and visualization
Bane Sullivan
A short term landscape evolution using a path sampling method to solve water and sediment flow continuity equations and model mass flows over complex topographies.

r.sim.terrain A short-term landscape evolution model that simulates topographic change for both steady state and dynamic flow regimes across a range o

Brendan Harmon 7 Oct 21, 2022
Rasterio reads and writes geospatial raster datasets

Rasterio Rasterio reads and writes geospatial raster data. Geographic information systems use GeoTIFF and other formats to organize and store gridded,

Mapbox 1.9k Jan 07, 2023
Enable geospatial data mining through Google Earth Engine in Grasshopper 3D, via its most recent Hops component.

AALU_Geo Mining This repository is produced for a masterclass at the Architectural Association Landscape Urbanism programme. Requirements Rhinoceros (

4 Nov 16, 2022
A package to fetch sentinel 2 Satellite data from Google.

Sentinel 2 Data Fetcher Installation Create a Virtual Environment and activate it. python3 -m venv venv . venv/bin/activate Install the Package via pi

1 Nov 18, 2021
A bot that tweets info and location map for new bicycle parking added to OpenStreetMap within a GeoJSON boundary.

Bike parking tweepy bot app A twitter bot app that searches for bicycle parking added to OpenStreetMap. Relies on AWS Lambda/S3, Python3, Tweepy, Flas

Angelo Trivisonno 1 Dec 19, 2021
Bacon - Band-limited Coordinate Networks for Multiscale Scene Representation

BACON: Band-limited Coordinate Networks for Multiscale Scene Representation Project Page | Video | Paper Official PyTorch implementation of BACON. BAC

Stanford Computational Imaging Lab 144 Dec 29, 2022
A Python tool to display geolocation information in the traceroute.

IP2Trace Python IP2Trace Python is a Python tool allowing user to get IP address information such as country, region, city, latitude, longitude, zip c

IP2Location 22 Jan 08, 2023
Implementation of Trajectory classes and functions built on top of GeoPandas

MovingPandas MovingPandas implements a Trajectory class and corresponding methods based on GeoPandas. Visit movingpandas.org for details! You can run

Anita Graser 897 Jan 01, 2023
This GUI app was created to show the detailed information about the weather in any city selected by user

WeatherApp Content Brief description Tools Features Hotkeys How it works Screenshots Ways to improve the project Installation Brief description This G

TheBugYouCantFix 5 Dec 30, 2022
Build, deploy and extract satellite public constellations with one command line.

SatExtractor Build, deploy and extract satellite public constellations with one command line. Table of Contents About The Project Getting Started Stru

Frontier Development Lab 70 Nov 18, 2022
Use Mapbox GL JS to visualize data in a Python Jupyter notebook

Location Data Visualization library for Jupyter Notebooks Library documentation at https://mapbox-mapboxgl-jupyter.readthedocs-hosted.com/en/latest/.

Mapbox 620 Dec 15, 2022
Solving the Traveling Salesman Problem using Self-Organizing Maps

Solving the Traveling Salesman Problem using Self-Organizing Maps This repository contains an implementation of a Self Organizing Map that can be used

Diego Vicente 3.1k Dec 31, 2022
Daily social mapping project in November 2021. Maps made using PyGMT whenever possible.

Daily social mapping project in November 2021. Maps made using PyGMT whenever possible.

Wei Ji 20 Nov 24, 2022
Manage your XYZ Hub or HERE Data Hub spaces from Python.

XYZ Spaces for Python Manage your XYZ Hub or HERE Data Hub spaces and Interactive Map Layer from Python. FEATURED IN: Online Python Machine Learning C

HERE Technologies 30 Oct 18, 2022
r.cfdtools 7 Dec 28, 2022
List of Land Cover datasets in the GEE Catalog

List of Land Cover datasets in the GEE Catalog A list of all the Land Cover (or discrete) datasets in Google Earth Engine. Values, Colors and Descript

David Montero Loaiza 5 Aug 24, 2022
Geocode rows in a SQLite database table

Geocode rows in a SQLite database table

Chris Amico 225 Dec 08, 2022
Raster-based Spatial Analysis for Python

🌍 xarray-spatial: Raster-Based Spatial Analysis in Python 📍 Fast, Accurate Python library for Raster Operations ⚡ Extensible with Numba ⏩ Scalable w

makepath 649 Jan 01, 2023
EOReader is a multi-satellite reader allowing you to open optical and SAR data.

Remote-sensing opensource python library reading optical and SAR sensors, loading and stacking bands, clouds, DEM and index.

ICube-SERTIT 152 Dec 30, 2022
A ready-to-use curated list of Spectral Indices for Remote Sensing applications.

A ready-to-use curated list of Spectral Indices for Remote Sensing applications. GitHub: https://github.com/davemlz/awesome-ee-spectral-indices Docume

David Montero Loaiza 488 Jan 03, 2023