Render Jupyter notebook in the terminal

Overview

jut - JUpyter notebook Terminal viewer.

The command line tool view the IPython/Jupyter notebook in the terminal.

Install

pip install jut

Usage

$jut --help
Usage: jut [OPTIONS]

Options:
  -u, --url TEXT             Render the ipynb file from the URL
  -i, --input-file FILENAME  File from the local file-system
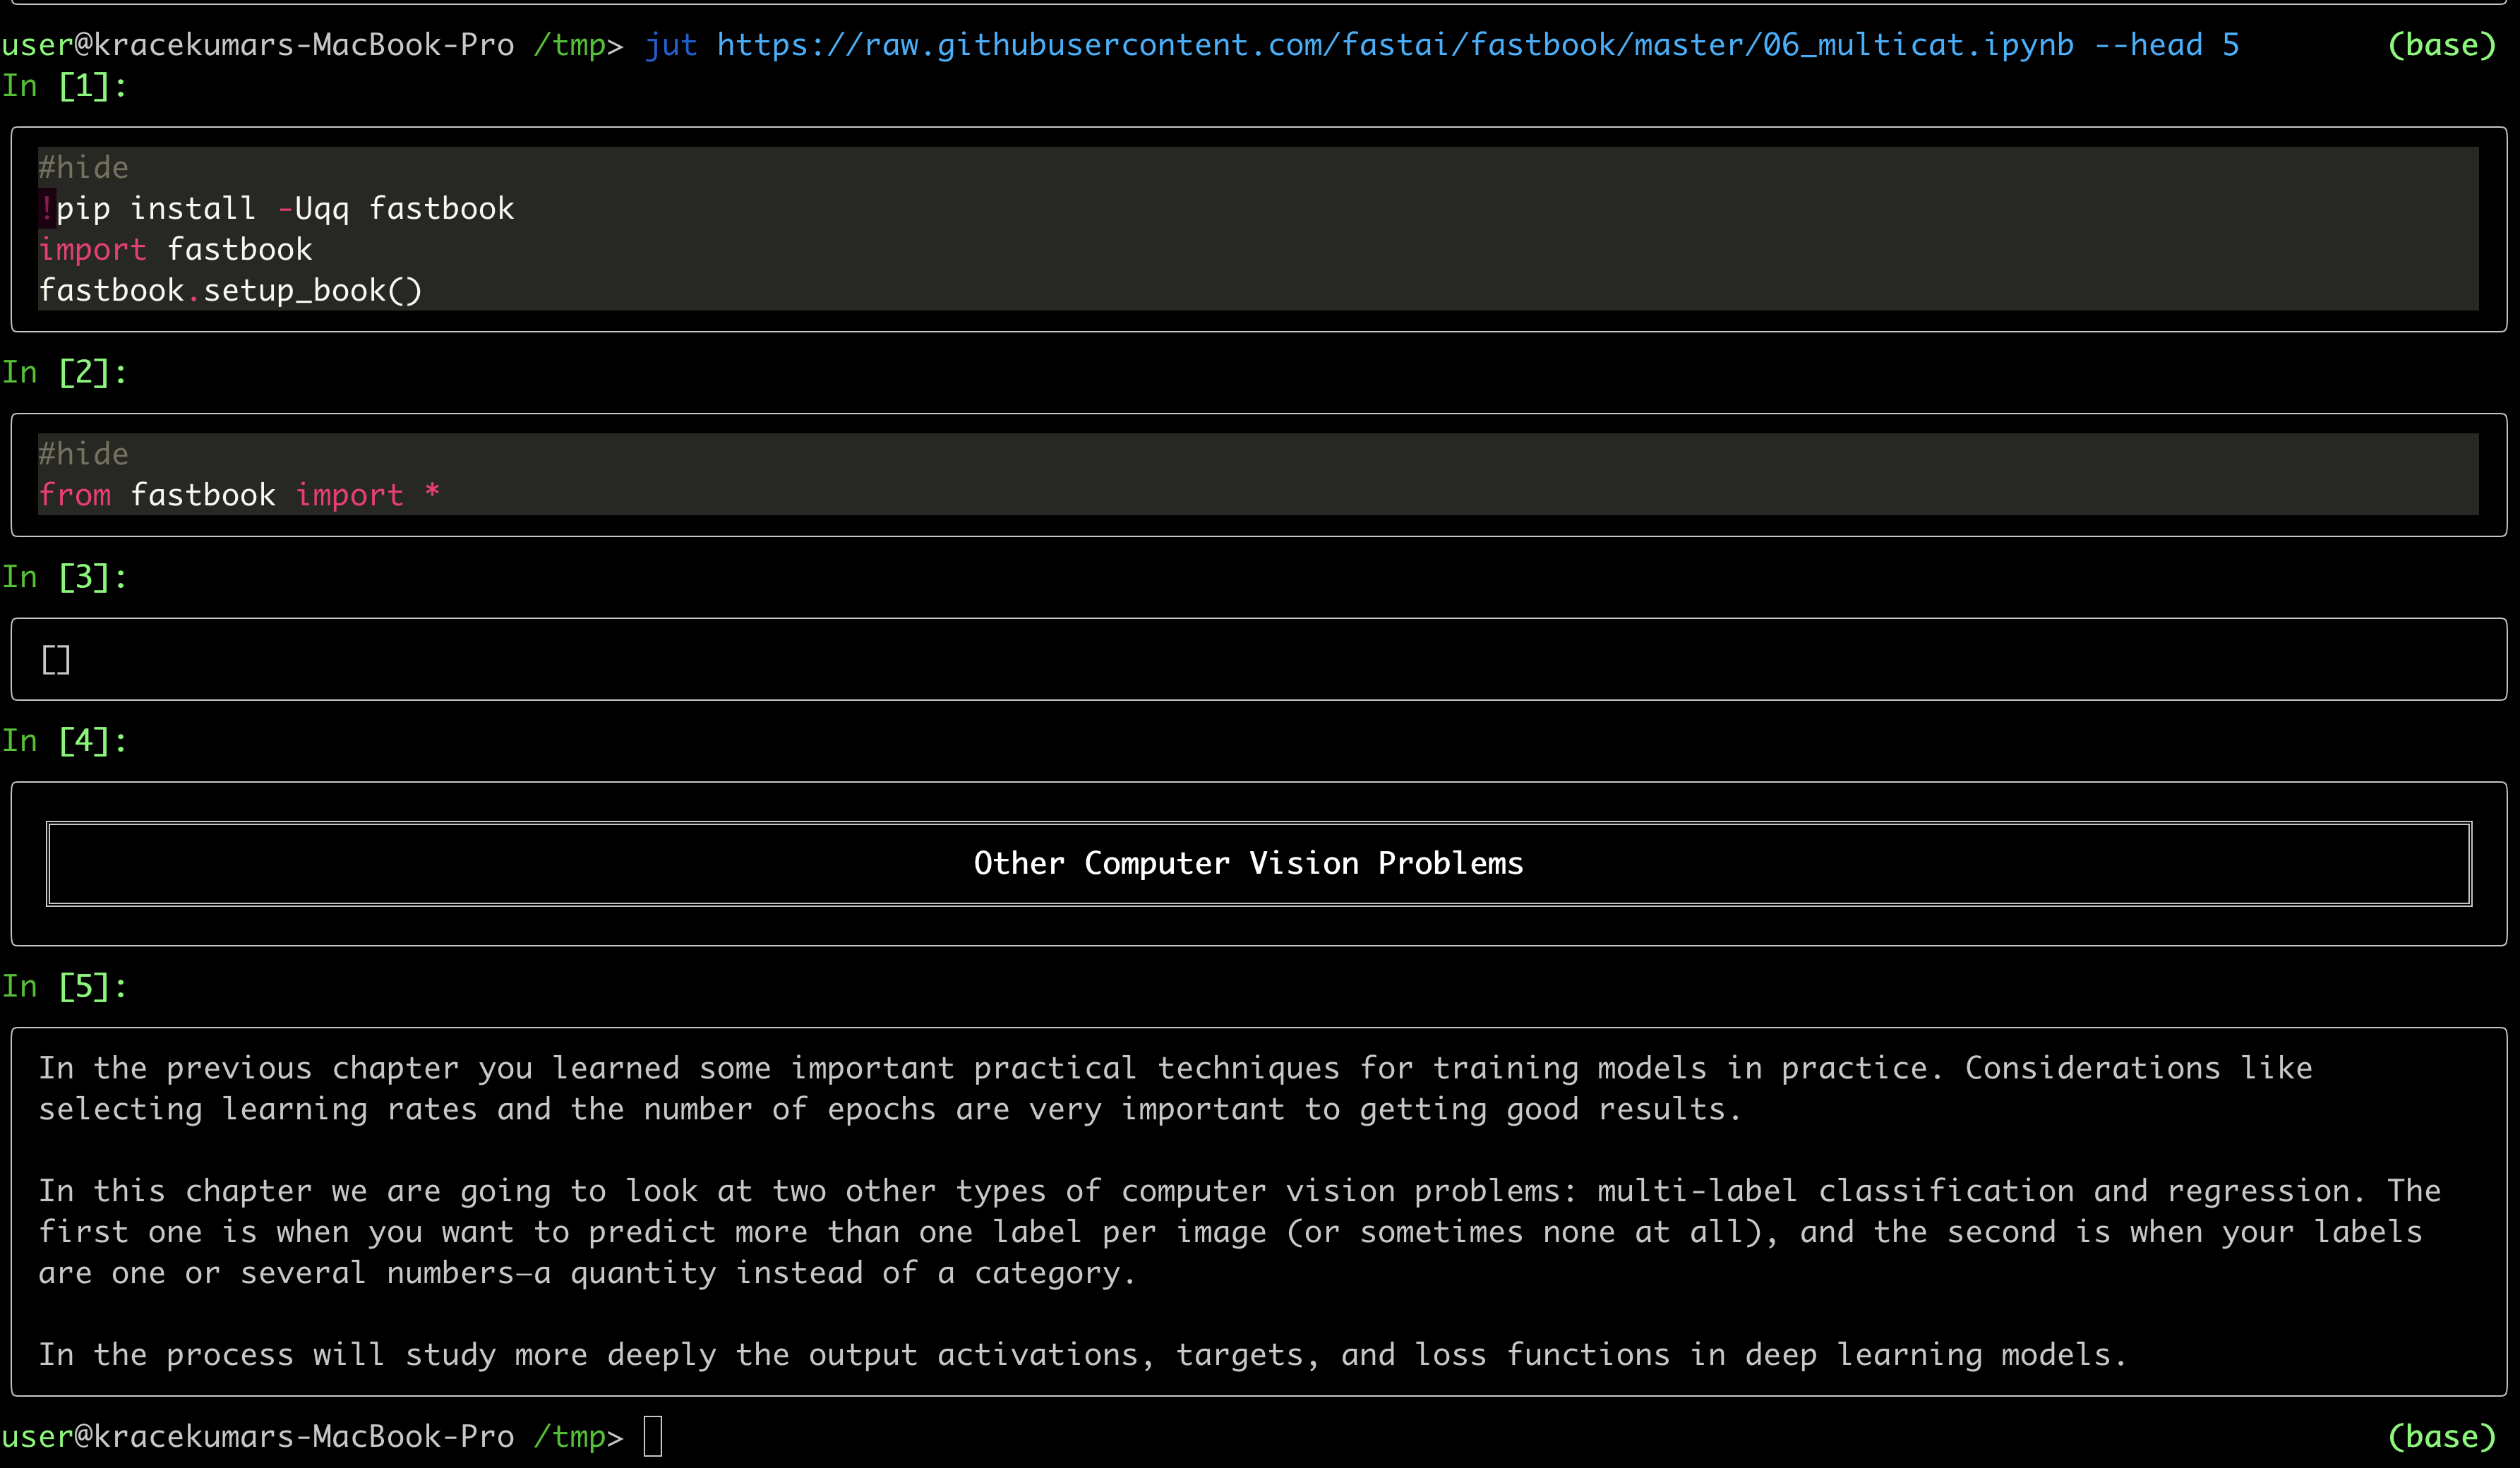
  -h, --head INTEGER         Display first n cells. Default is 10
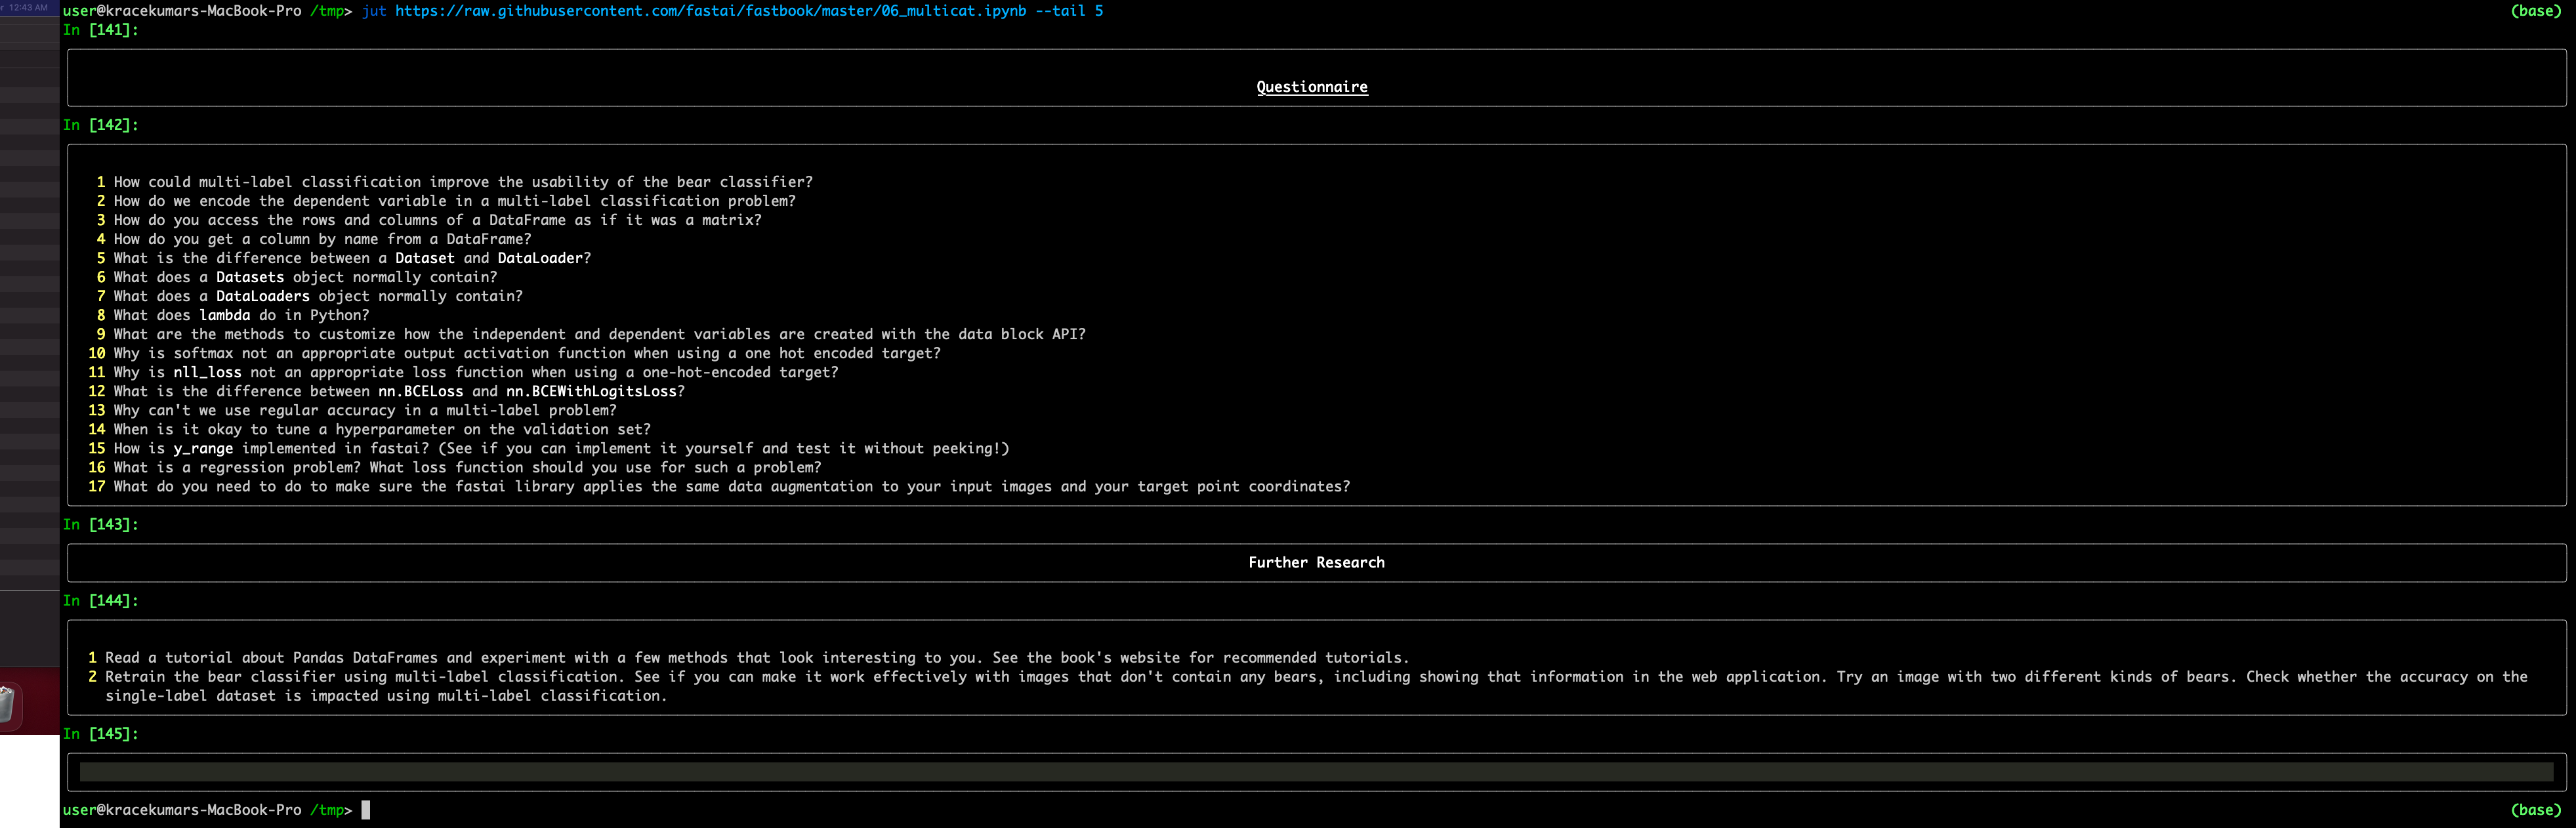
  -t, --tail INTEGER         Display last n cells
  -p, --single-page          Should the result be in a single page?
  -f, --full-display         Should all the contents in the file displayed?
  --help                     Show this message and exit.

ASCIICinema Demo

asciicast

Display first five cells

jut-head-example

Display last five cells

jut-tail-example

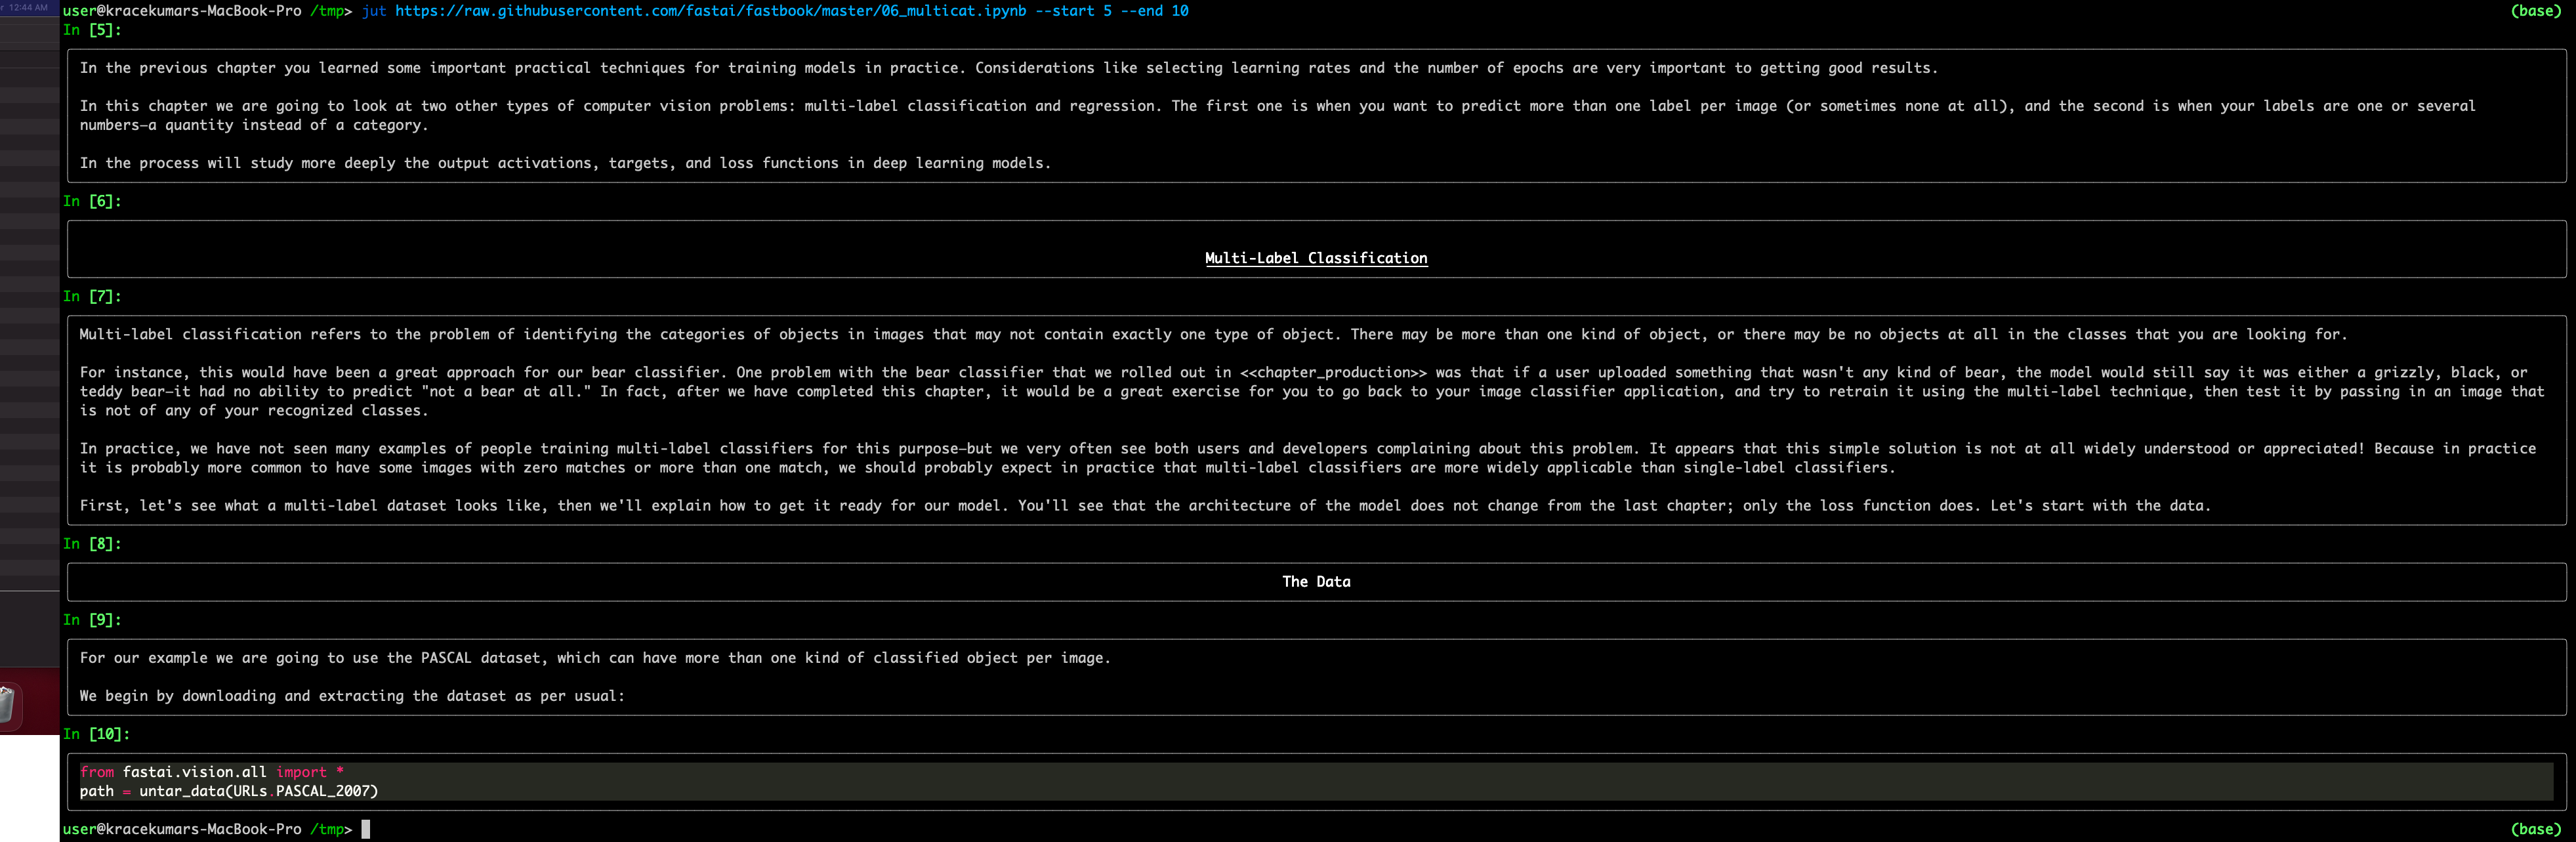
Download the file and display first five cells

jut-download-url

Owner
Kracekumar
Server side guy specializing in Python. I am interested in back-end technologies, machine learning, automation, systems and performance.
Kracekumar
Leyna's Visualizing Data With Python

Leyna's Visualizing Data Below is information on the number of bilingual students in three school districts in Massachusetts. You will also find infor

11 Oct 28, 2021
Visualization Website by using Dash and Heroku

Visualization Website by using Dash and Heroku You can visit the website https://payroll-expense-analysis.herokuapp.com/ In this project, I am interes

YF Liu 1 Jan 14, 2022
An open-source tool for visual and modular block programing in python

PyFlow PyFlow is an open-source tool for modular visual programing in python ! Although for now the tool is in Beta and features are coming in bit by

1.1k Jan 06, 2023
Render tokei's output to interactive sunburst chart.

Render tokei's output to interactive sunburst chart.

134 Dec 15, 2022
Write python locally, execute SQL in your data warehouse

RasgoQL Write python locally, execute SQL in your data warehouse ≪ Read the Docs · Join Our Slack » RasgoQL is a Python package that enables you to ea

Rasgo 265 Nov 21, 2022
Debugging, monitoring and visualization for Python Machine Learning and Data Science

Welcome to TensorWatch TensorWatch is a debugging and visualization tool designed for data science, deep learning and reinforcement learning from Micr

Microsoft 3.3k Dec 27, 2022
Homework 2: Matplotlib and Data Visualization

Homework 2: Matplotlib and Data Visualization Overview These data visualizations were created for my introductory computer science course using Python

Sophia Huang 12 Oct 20, 2022
A python-generated website for visualizing the novel coronavirus (COVID-19) data for Greece.

COVID-19-Greece A python-generated website for visualizing the novel coronavirus (COVID-19) data for Greece. Data sources Data provided by Johns Hopki

Isabelle Viktoria Maciohsek 23 Jan 03, 2023
Graphical display tools, to help students debug their class implementations in the Carcassonne family of projects

carcassonne_tools Graphical display tools, to help students debug their class implementations in the Carcassonne family of projects NOTE NOTE NOTE The

1 Nov 08, 2021
Log visualizer for whirl-framework

Lumberjack Log visualizer for whirl-framework Установка pip install -r requirements.txt Как пользоваться python3 lumberjack.py -l путь до лога -o

Vladimir Malinovskii 2 Dec 19, 2022
metedraw is a project mainly for data visualization projects of Atmospheric Science, Marine Science, Environmental Science or other majors

It is mainly for data visualization projects of Atmospheric Science, Marine Science, Environmental Science or other majors.

Nephele 11 Jul 05, 2022
This repository contains a streaming Dataflow pipeline written in Python with Apache Beam, reading data from PubSub.

Sample streaming Dataflow pipeline written in Python This repository contains a streaming Dataflow pipeline written in Python with Apache Beam, readin

Israel Herraiz 9 Mar 18, 2022
Joyplots in Python with matplotlib & pandas :chart_with_upwards_trend:

JoyPy JoyPy is a one-function Python package based on matplotlib + pandas with a single purpose: drawing joyplots (a.k.a. ridgeline plots). The code f

Leonardo Taccari 462 Jan 02, 2023
A blender import/export system for Defold

defold-blender-export A Blender export system for the Defold game engine. Setup Notes There are no exhaustive documents for this tool yet. Its just no

David Lannan 27 Dec 30, 2022
Python package for hypergraph analysis and visualization.

The HyperNetX library provides classes and methods for the analysis and visualization of complex network data. HyperNetX uses data structures designed to represent set systems containing nested data

Pacific Northwest National Laboratory 304 Dec 27, 2022
OpenStats is a library built on top of streamlit that extracts data from the Github API and shows the main KPIs

Open Stats Discover and share the KPIs of your OpenSource project. OpenStats is a library built on top of streamlit that extracts data from the Github

Pere Miquel Brull 4 Apr 03, 2022
Generating interfaces(CLI, Qt GUI, Dash web app) from a Python function.

oneFace is a Python library for automatically generating multiple interfaces(CLI, GUI, WebGUI) from a callable Python object. oneFace is an easy way t

NaNg 31 Oct 21, 2022
Create a table with row explanations, column headers, using matplotlib

Create a table with row explanations, column headers, using matplotlib. Intended usage was a small table containing a custom heatmap.

4 Aug 14, 2022
This is a Cross-Platform Plot Manager for Chia Plotting that is simple, easy-to-use, and reliable.

Swar's Chia Plot Manager A plot manager for Chia plotting: https://www.chia.net/ Development Version: v0.0.1 This is a cross-platform Chia Plot Manage

Swar Patel 1.3k Dec 13, 2022
Main repository for Vispy

VisPy: interactive scientific visualization in Python Main website: http://vispy.org VisPy is a high-performance interactive 2D/3D data visualization

vispy 3k Jan 03, 2023