Epilog
>> Dead simple container log aggregation with ELK stack <<
Preface
Epilog aims to demonstrate a language-agnostic, non-invasive, and straightforward way to add centralized logging to your stack. Centralized logging can be difficult depending on how much control you need over the log messages, how robust you need the logging system to be, and how you want to display the data to the consumer.
Why?
Invasive logging usually entails you having to build a logging pipeline and integrate that into your application. Adding an extensive logging workflow directly to your application is non-trivial for a few reasons:
-
The workflow becomes language-specific and hard to scale as your application gets decentralized over time and starts to take advantage of multiple languages.
-
The logging pipeline gets tightly coupled with the application code.
-
Extensive logging in a blocking manner can significantly hurt the performance of the application.
-
Doing logging in a non-blocking state is difficult and usually requires a non-trivial amount of application code changes when the logging requirements change.
This repository lays out a dead-simple but extensible centralized logging workflow that collects logs from docker containers in a non-invasive manner. To achieve this, we've used the reliable ELK stack which is at this point, an industry standard.
Features
-
Asynchronous log-aggregation pipeline that's completely decoupled from the app instances generating the logs.
-
Zero effect on performance if the app instances aren't doing expensive synchronous logging operations internally.
-
Horizontal scaling is achievable by adding more nodes to the Elasticsearch cluster.
-
To keep the storage requirements at bay, log messages are automatically deleted after 7 days. This is configurable.
-
Synchronization during container startup to reduce the number of missing logs.
-
All the Log messages can be filtered and queried interactively from a centralized location via the Kibana dashboard.
Architecture
This workflow leverages Filebeat to collect the logs, Elasticsearch to store and query the log messages, and Kibana to visualize the data interactively. The following diagram explains how logs flow from your application containers and becomes queryable in the Kibana dashboards:

Here, the Application is a dockerized Python module that continuously sends log messages to the standard output.
On a Unix machine, Docker containers save these log messages in the /var/lib/docker/containers/*/*.log directory. In this directory, Filebeat listens for new log messages and sends them to Elasticsearch in batches. This makes the entire logging workflow asynchronous as Filebeat isn't coupled with the application and is lightweight enough to be deployed with every instance of your application.
The log consumer can make query requests via the Kibana dashboards and interactively search and filter the relevant log messages. The Caddy reverse proxy server is helpful during local development as you won't have to memorize the ports to access Elasticsearch and Kibana. You can also choose to use Caddy instead of Ngnix as a reverse proxy and load balancer in your production orchestration.
Installation
-
Make sure you have Docker, Docker compose V2 installed on your system.
-
Clone the repo.
-
Go to the root directory and run:
make upThis will spin up 2 Elasticsearch nodes, 1 Filebeat instance, 1 log emitting app instance, and the reverse proxy server.
-
To shut down everything gracefully, run:
make down -
To kill the container processes and clean up all the volumes, run:
make kill && make clean
Exploration
Once you've run the make up command:
-
To access the Kibana dashboard, go to
https://kibana.localhost. Since our reverse proxy adds SSL to the localhost, your browser will complain about the site being unsafe. Just ignore it and move past. -
When prompted for credentials, use
elasticas username anddebianas password. You can configure this in the.envfile. -
Once you're inside the Kibana dashboard, head over to the Logs panel under the Observability section on the left panel.

-
You can filter the logs by container name. Once you start typing
container.nameliterally, Kibana will give you suggestions based on the names of the containers running on your machine.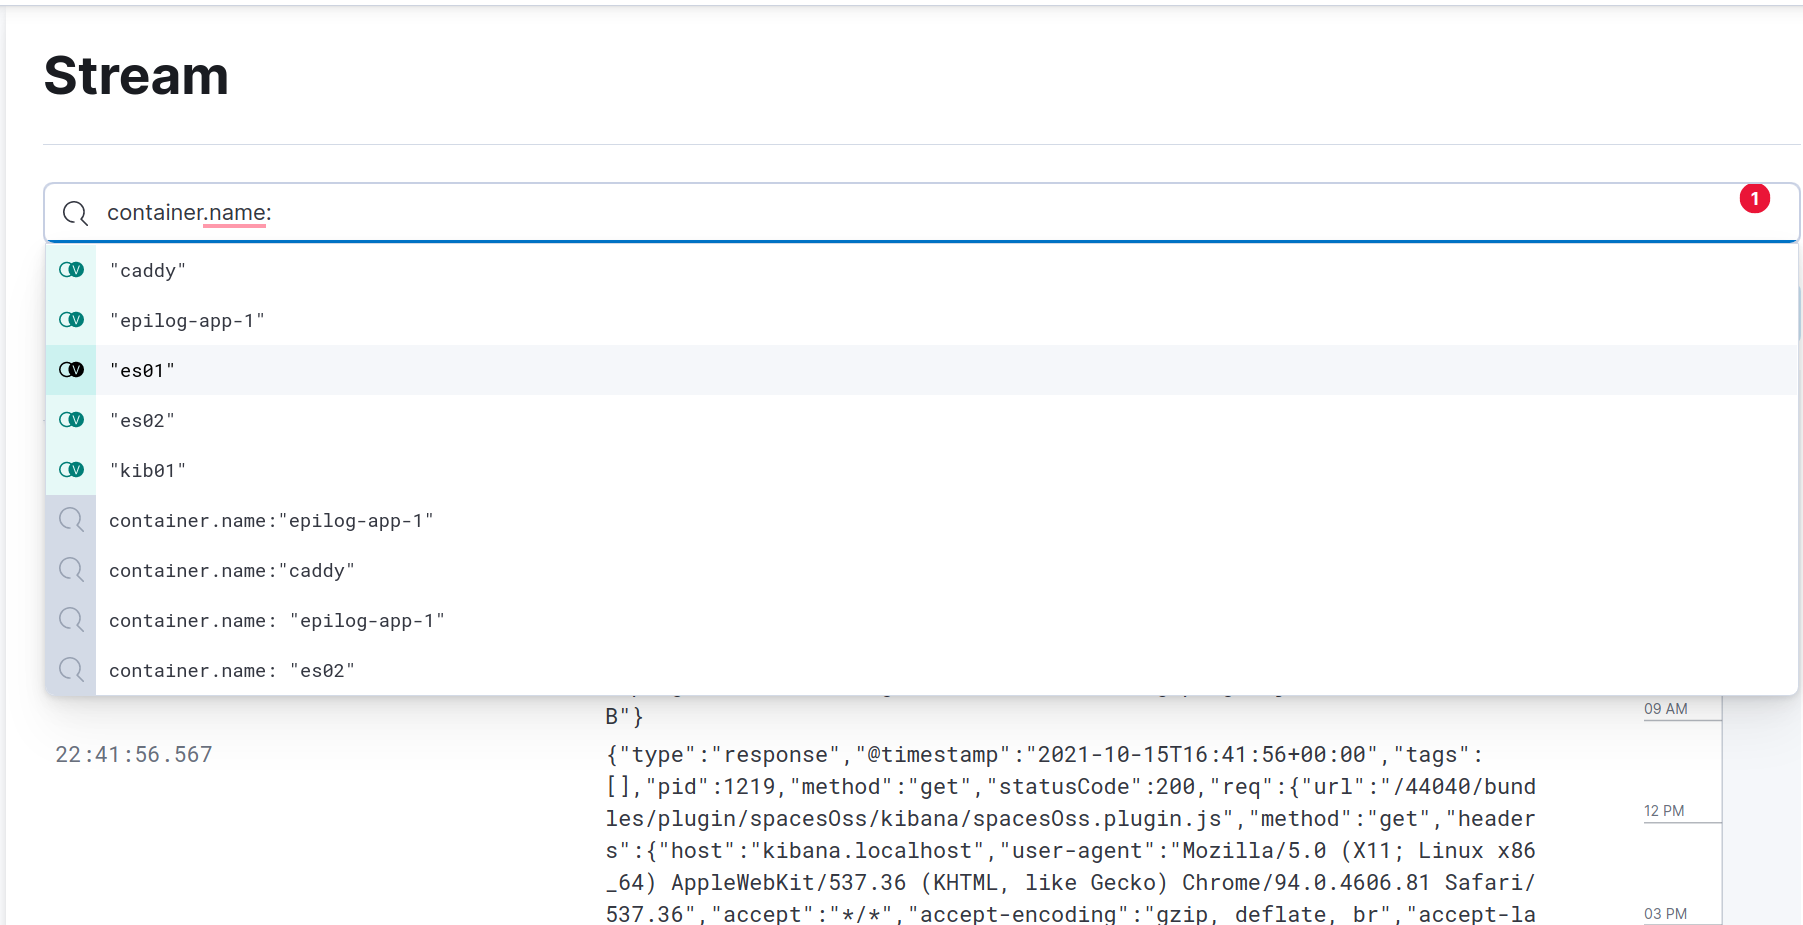 )
) -
Another filter you might want to explore is filtering by hostname. To do so, type
host.nameand it'll show the available host identifiers in a dropdown. In this case, all the containers live in the same host. So there's only one available host to filter by. These filters are defined in theprocessorssegment of thefilebeat.ymlfile. You can find a comprehensive list ofprocessorshere.
Maintenance & Extensibility
-
If you need log transformation, adding Logstash to this stack is quite easy. All you'll have to do is add a Logstash instance to the docker-compose.yml file and point Filebeat to send the logs to Logstash instead of Elasticsearch. Logstash will then transform the logs and save them in the Elasticsearch search cluster.
-
To scale up the Elasticsearch cluster, you can follow the configuration of
es02node in the docker-compose file. More nodes can be added similarly to achieve horizontal scaling. -
In a production setup, your app will most likely live in separate hosts than the Elasticsearch clusters. In that case, a Filebeat instance should live with every instance of the log generating app and these will send the logs to a centralized location—directly to Elasticsearch or first to Logstash and then to Elasticsearch clusters—depending on your need.
Disclaimer
-
This pipleline was tested in a Unix-like system, mainly Ubuntu and macOS. Also, the bash scripts might not work out of the box on Windows.
-
This setup only employs a rudimentary password-based authentication system. You should add TLS encryption to your production ELK stack. Here's an example of how you might be able to do so.
-
For demonstration purposes, this repository has
.envfile in the root directory. In your production application, you should never add the.envfiles to your version control system.
Resources
-
Elasticsearch: What It Is, How It Works, And What It’s Used For
-
ELK: Delete old logging data using the Index Lifecycle Management

 1 Nov 15, 2021
 3 Jan 10, 2022
 2.6k Jan 04, 2023
 1 Nov 16, 2021
 365 Nov 11, 2022
 15 Dec 16, 2022
 1.4k Jan 04, 2023
 176 Jan 01, 2023
 56 Jan 03, 2023
 0 May 24, 2022
 17 May 03, 2022
 45 Sep 25, 2022
 1 Nov 11, 2021
 11 May 16, 2022
 2 Nov 25, 2021
 924 Jan 05, 2023
 3.9k Jan 03, 2023
 2 Jul 06, 2022
 102 Dec 22, 2022
 1 Feb 12, 2022