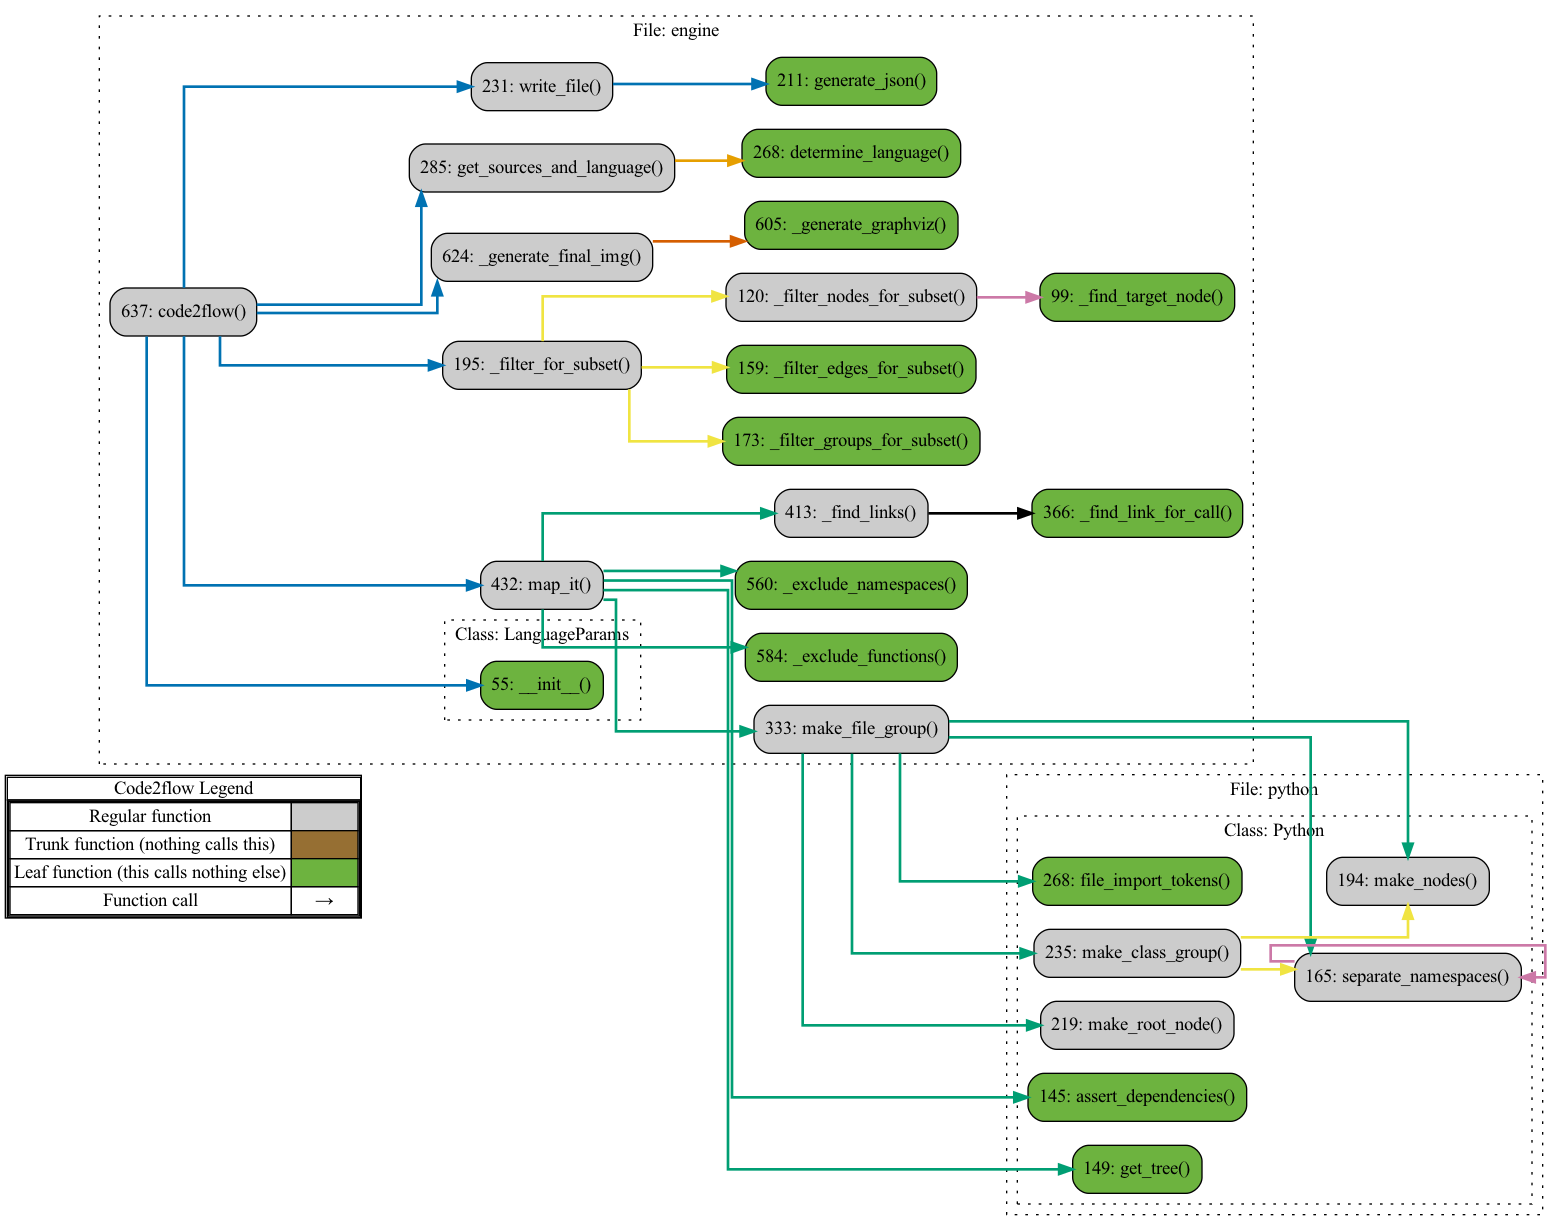
Code2flow generates call graphs for dynamic programming language. Code2flow supports Python, Javascript, Ruby, and PHP.
The basic algorithm is simple:
- Translate your source files into ASTs.
- Find all function definitions.
- Determine where those functions are called.
- Connect the dots.
Code2flow is useful for:
- Untangling spaghetti code.
- Identifying orphaned functions.
- Getting new developers up to speed.
Code2flow will provide a pretty good estimate of your project's structure. No algorithm can generate a perfect call graph for a dynamic language - even less so if that language is duck-typed. See the known limitations in the section below.
(Below: Code2flow running on itself (excl javascript, PHP, & Ruby for clarity))
Installation
pip3 install code2flow
If you don't have it already, you will also need to install graphviz. Installation instructions can be found here.
Usage
To generate a DOT file run something like:
code2flow mypythonfile.py
Or, for javascript:
code2flow myjavascriptfile.js
You can also specify multiple files or import directories:
code2flow project/directory/source_a.js project/directory/source_b.js
code2flow project/directory/*.js
code2flow project/directory --language js
There are a ton of command line options, to see them all, run:
code2flow --help
How code2flow works
Code2flow approximates the structure of projects in dynamic languages. It is not possible to generate a perfect callgraph for a dynamic language.
Detailed algorithm:
- Generate an AST of the source code
- Recursively separate groups and nodes. Groups are files, modules, or classes. More precisely, groups are namespaces where functions live. Nodes are the functions themselves.
- For all nodes, identify function calls in those nodes.
- For all nodes, identify in-scope variables. Attempt to connect those variables to specific nodes and groups. This is where there is some ambiguity in the algorithm because it is possible to know the types of variables in dynamic languages. So, instead, heuristics must be used.
- For all calls in all nodes, attempt to find a match from the in-scope variables. This will be an edge.
- If a definitive match from in-scope variables cannot be found, attempt to find a single match from all other groups and nodes.
- Trim orphaned nodes and groups.
- Output results.
Why is it impossible to generate a perfect call graph?
Consider this toy example in Python
def func_factory(param):
    if param < .5:
        return func_a
    else:
        return func_b

func = func_factory(important_variable)
func()
We have no way of knowing whether func will point to func_a or func_b until runtime. In practice, ambiguity like this is common and is present in most non-trivial applications.
Known limitations
Code2flow is internally powered by ASTs. Most limitations stem from a token not being named what code2flow expects it to be named.
- All functions without definitions are skipped. This most often happens when a file is not included.
- Functions with identical names in different namespaces are (loudly) skipped. E.g. If you have two classes with identically named methods, code2flow cannot distinguish between these and skips them.
- Imported functions from outside of your project directory (including from standard libraries) which share names with your defined functions may not be handled correctly. Instead when you call the imported function, code2flow will link to your local functions. E.g. if you have a function "search()" and call, "import searcher; searcher.search()", code2flow may link (incorrectly) to your defined function.
- Anonymous or generated functions are skipped. This includes lambdas and factories.
- If a function is renamed, either explicitly or by being passed around as a parameter, it will be skipped.
How to contribute
- Open an issue: Code2flow is not perfect and there is a lot that can be improved. If you find a problem parsing your source that you can identify with a simplified example, please open an issue.
- Create a PR: Even better, if you have a fix for the issue you identified that passes unit tests, please open a PR.
- Add a language: While dense, each language implementation is between 250-400 lines of code including comments. If you want to implement another language, the existing implementations can be your guide.
License
Code2flow is licensed under the MIT license. Prior to the rewrite in April 2021, code2flow was licensed under LGPL. The last commit under that license was 24b2cb854c6a872ba6e17409fbddb6659bf64d4c. The April 2021 rewrite was substantial so it's probably reasonable to treat code2flow as completely MIT-licensed.
Acknowledgements
- In mid-2021, Code2flow was rewritten and two new languages were added. This was prompted and financially supported by the Sider Corporation.
- The code2flow pip name was graciouly transferred to this project from Dheeraj Nair. He was using it for his own (unrelated) code2flow project.
- Many others have contributed through bug fixes, cleanups, and identifying issues. Thank you!!!
Unrelated projects
The name, "code2flow", has been used for several unrelated projects. Specifically, the domain, code2flow.com, has no association with this project. I've never heard anything from them and it doesn't appear like they use anything from here.
Feedback / Contact
Please do email! [email protected]
Feature Requests
Email me. At any time, I'm spread thin across a lot of projects so I will, unfortunately, turn down most requests. However, I am open to paid development for compelling features.


