View part of your screen in grayscale or simulated color vision deficiency.

Overview

monolens

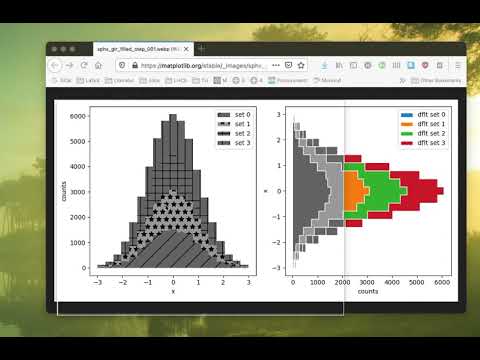
View part of your screen in grayscale or filtered to simulate color vision deficiency.

Watch the demo on YouTube.

Install with pip install monolens and then run monolens in a terminal or do it in one command with pipx run monolens.

Monolens was featured on Twitter by Matthew Feickert and Matplotlib, and picked up in this episode of Python Bytes. Thanks, guys!

Usage

  • Drag the lens around by holding a Mouse button down inside the window
  • Press Escape, Q, or double click on the lens to quit
  • Press up, down, left, right to resize the lens
  • Press Tab to switch between greyscale and different forms of simulated colorblindness
  • Press I to switch view label on/off
  • Press M to move the lens to another screen

On OSX, you need to give Monolens permission to make screenshots, which is safe.

Known limitations

  • The app is tested on OSX and Linux. It may flicker when you move the lens (less so on OSX). If you know how to fix this, please help. :)
  • Pulling the lens to another screen is currently not supported. See usage on how to switch screens instead.
  • The lens actually uses a static screenshot which is updated as you move the lens around. This trick is necessary, because an app cannot read the pixels under its own window. Because of this, the pixels under the app are only updated when you move the lens away first and then back. This is also the reason why the lens only works for static images.
  • On OSX, an ordinary app is not allowed to read pixels outside of its window for security reasons, which is why this app needs special permissions. Giving permissions is safe; Monolens contains no networking code and will neither store nor send your pixels anywhere.

Future plans

  • Support gestures to rescale the lens (pinch etc)
Comments
  • GitHub Action to lint Python code

    GitHub Action to lint Python code

    Output: https://github.com/cclauss/monolens/actions

    Future PRs should remove || true from:

    • [ ] isort --check-only --profile black . || true
    • [ ] pytest . || true
    opened by cclauss 1
  • Monolens sees through open application windows

    Monolens sees through open application windows

    When I open monolens on OSX 10.15.7 (Catalina) the viewer window always appears to peer through any of the application windows I have open and show only the desktop. For example, in the screenshot below I have a PDF document open in Preview but the monolens window views through it to the desktop image (which I have as the default OSX Catalina one):

    image

    or here when I call it using pipx:

    image

    I am not sure if this is in any way related to the permissions setup described in the project README,

    On OSX, you need to give Monolens permission to make screenshots, which is safe.

    I am unsure how to actively give those permissions.

    Any ideas?

    opened by dantrim 1
  • Using published package on pypi doesn't work because readme is not found

    Using published package on pypi doesn't work because readme is not found

    ❯ monolens
    Traceback (most recent call last):
      File "/home/maxnoe/.local/bin/monolens", line 8, in <module>
        sys.exit(main())
      File "/home/maxnoe/.local/lib/python3.9/site-packages/monolens/__init__.py", line 25, in main
        intro = Intro()
      File "/home/maxnoe/.local/lib/python3.9/site-packages/monolens/intro.py", line 17, in __init__
        with open(Path(__file__).parent / ".." / "README.md") as f:
    FileNotFoundError: [Errno 2] No such file or directory: '/home/maxnoe/.local/lib/python3.9/site-packages/monolens/../README.md'
    
    opened by maxnoe 1
  • Fix wrong method name in enterEvent

    Fix wrong method name in enterEvent

    Fixes this error:

    Traceback (most recent call last):
      File "/home/maxnoe/.local/lib/python3.9/site-packages/monolens/widget.py", line 48, in enterEvent
        super(Widget, self).eventEvent(event)
    AttributeError: 'super' object has no attribute 'eventEvent'
    

    When entering with the mouse.

    opened by maxnoe 1
  • [pre-commit.ci] pre-commit autoupdate

    [pre-commit.ci] pre-commit autoupdate

    opened by pre-commit-ci[bot] 0
  • Missing wayland support

    Missing wayland support

    I tried monolens under wayland with the sway window manager via pipx and it crashed with

    On OSX, you need to give Monolens permission to make screenshots, which is safe.
    Traceback (most recent call last):
      File "/home/michael/.local/pipx/.cache/ec49a1adcc18bdc/bin/monolens", line 8, in <module>
        sys.exit(main())
      File "/home/michael/.local/pipx/.cache/ec49a1adcc18bdc/lib/python3.9/site-packages/monolens/__init__.py", line 46, in main
        lens = Lens()
      File "/home/michael/.local/pipx/.cache/ec49a1adcc18bdc/lib/python3.9/site-packages/monolens/lens.py", line 35, in __init__
        self._updateScreenshot(self.screen())
      File "/home/michael/.local/pipx/.cache/ec49a1adcc18bdc/lib/python3.9/site-packages/monolens/lens.py", line 187, in _updateScreenshot
        self._updateConverted()
      File "/home/michael/.local/pipx/.cache/ec49a1adcc18bdc/lib/python3.9/site-packages/monolens/lens.py", line 191, in _updateConverted
        util.grayscale(self._converted, self._screenshot)
      File "/home/michael/.local/pipx/.cache/ec49a1adcc18bdc/lib/python3.9/site-packages/monolens/util.py", line 66, in grayscale
        s = qimage_array_view(source)
      File "/home/michael/.local/pipx/.cache/ec49a1adcc18bdc/lib/python3.9/site-packages/monolens/util.py", line 45, in qimage_array_view
        assert format == QtGui.QImage.Format_RGB32
    AssertionError
    

    I'm not entirely surprise, since screenshotting utilities etc. are different under wayland. But from the stacktrace it's not obvious why exactly it crashed and in theory, Qt should be able to handle wayland, or shouldn't it?

    Anyway, would be cool if someone else could try it and if they can reproduce it, add it to the limitations in the readme, after all wayland is slowly becoming more mainstream. But maybe just something with my system configuration is broken :man_shrugging:

    opened by meliache 3
Owner
Hans Dembinski
Particle physicist, C++ and Python expert, statistician. Author of boost::histogram.
Hans Dembinski
Lightweight, extensible data validation library for Python

Cerberus Cerberus is a lightweight and extensible data validation library for Python. v = Validator({'name': {'type': 'string'}}) v.validate({

eve 2.9k Dec 27, 2022
Visualization Library

CamViz Overview // Installation // Demos // License Overview CamViz is a visualization library developed by the TRI-ML team with the goal of providing

Toyota Research Institute - Machine Learning 67 Nov 24, 2022
Lightweight data validation and adaptation Python library.

Valideer Lightweight data validation and adaptation library for Python. At a Glance: Supports both validation (check if a value is valid) and adaptati

Podio 258 Nov 22, 2022
A Jupyter - Three.js bridge

pythreejs A Python / ThreeJS bridge utilizing the Jupyter widget infrastructure. Getting Started Installation Using pip: pip install pythreejs And the

Jupyter Widgets 844 Dec 27, 2022
This is a learning tool and exploration app made using the Dash interactive Python framework developed by Plotly

Support Vector Machine (SVM) Explorer This app has been moved here. This repo is likely outdated and will not be updated. This is a learning tool and

Plotly 150 Nov 03, 2022
Blender addon that creates a temporary window of any type from the 3D View.

CreateTempWindow2.8 Blender addon that creates a temporary window of any type from the 3D View. Features Can the following window types: 3D View Graph

3 Nov 27, 2022
Eulera Dashboard is an easy and intuitive way to get a quick feel of what’s happening on the world’s market.

an easy and intuitive way to get a quick feel of what’s happening on the world’s market ! Eulera dashboard is a tool allows you to monitor historical

Salah Eddine LABIAD 4 Nov 25, 2022
Generate the report for OCULTest.

Sample report generated in this function Usage example from utils.gen_report import generate_report if __name__ == '__main__': # def generate_rep

Philip Guo 1 Mar 10, 2022
Automate the case review on legal case documents and find the most critical cases using network analysis

Automation on Legal Court Cases Review This project is to automate the case review on legal case documents and find the most critical cases using netw

Yi Yin 7 Dec 28, 2022
Python histogram library - histograms as updateable, fully semantic objects with visualization tools. [P]ython [HYST]ograms.

physt P(i/y)thon h(i/y)stograms. Inspired (and based on) numpy.histogram, but designed for humans(TM) on steroids(TM). The goal is to unify different

Jan Pipek 120 Dec 08, 2022
This is Pygrr PolyArt, a program used for drawing custom Polygon models for your Pygrr project!

This is Pygrr PolyArt, a program used for drawing custom Polygon models for your Pygrr project!

Isaac 4 Dec 14, 2021
Draw datasets from within Jupyter.

drawdata This small python app allows you to draw a dataset in a jupyter notebook. This should be very useful when teaching machine learning algorithm

vincent d warmerdam 505 Nov 27, 2022
Matplotlib tutorial for beginner

matplotlib is probably the single most used Python package for 2D-graphics. It provides both a very quick way to visualize data from Python and publication-quality figures in many formats. We are goi

Nicolas P. Rougier 2.6k Dec 28, 2022
Python scripts to manage Chia plots and drive space, providing full reports. Also monitors the number of chia coins you have.

Chia Plot, Drive Manager & Coin Monitor (V0.5 - April 20th, 2021) Multi Server Chia Plot and Drive Management Solution Be sure to ⭐ my repo so you can

338 Nov 25, 2022
`charts.css.py` brings `charts.css` to Python. Online documentation and samples is available at the link below.

charts.css.py charts.css.py provides a python API to convert your 2-dimension data lists into html snippet, which will be rendered into charts by CSS,

Ray Luo 3 Sep 23, 2021
plotly scatterplots which show molecule images on hover!

molplotly Plotly scatterplots which show molecule images on hovering over the datapoints! Required packages: pandas rdkit jupyter_dash ➡️ See example.

150 Dec 28, 2022
Fastest Gephi's ForceAtlas2 graph layout algorithm implemented for Python and NetworkX

ForceAtlas2 for Python A port of Gephi's Force Atlas 2 layout algorithm to Python 2 and Python 3 (with a wrapper for NetworkX and igraph). This is the

Bhargav Chippada 227 Jan 05, 2023
Debugging, monitoring and visualization for Python Machine Learning and Data Science

Welcome to TensorWatch TensorWatch is a debugging and visualization tool designed for data science, deep learning and reinforcement learning from Micr

Microsoft 3.3k Dec 27, 2022
Plot, scatter plots and histograms in the terminal using braille dots

Plot, scatter plots and histograms in the terminal using braille dots, with (almost) no dependancies. Plot with color or make complex figures - similar to a very small sibling to matplotlib. Or use t

Tammo Ippen 207 Dec 30, 2022
A Python toolbox for gaining geometric insights into high-dimensional data

"To deal with hyper-planes in a 14 dimensional space, visualize a 3D space and say 'fourteen' very loudly. Everyone does it." - Geoff Hinton Overview

Contextual Dynamics Laboratory 1.8k Dec 29, 2022