Streaming pivot visualization via WebAssembly

Overview

Perspective

npm PyPI Build Status FINOS - Active

Perspective is an interactive visualization component for large, real-time datasets. Originally developed for J.P. Morgan's trading business, Perspective makes it simple to build user-configurable analytics entirely in the browser, or in concert with Python and/or JupyterLab. Use it to create reports, dashboards, notebooks and applications, with static data or streaming updates via Apache Arrow.

Features

  • A fast, memory efficient streaming query engine, written in C++ and compiled for both WebAssembly and Python, with read/write/stream/virtual support for Apache Arrow.

  • A framework-agnostic User Interface component and Jupyterlab Widget, over WebWorker (WebAssembly) or WebSocket (Python/Node), and a suite of Datagrid and D3FC Chart plugins. `
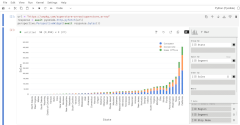
Examples

Superstore Olympics Custom Styles
Editable Streaming CSV
IEX Cloud NYC Citibike JupyterLab Plugin

Documentation

Owner
The Fintech Open Source Foundation (www.finos.org)
FINOS’ mission is to promote open innovation in financial services. See our full list of repos from our nearly 100 projects & 11 programs at finos.github.io
The Fintech Open Source Foundation (www.finos.org)
python partial dependence plot toolbox

PDPbox python partial dependence plot toolbox Motivation This repository is inspired by ICEbox. The goal is to visualize the impact of certain feature

Li Jiangchun 723 Jan 07, 2023
A Simple Flask-Plotly Example for NTU 110-1 DSSI Class

A Simple Flask-Plotly Example for NTU 110-1 DSSI Class Live Demo Prerequisites We will use Flask and Ploty to build a Flask application. If you haven'

Ting Ni Wu 1 Dec 11, 2021
Here I plotted data for the average test scores across schools and class sizes across school districts.

HW_02 Here I plotted data for the average test scores across schools and class sizes across school districts. Average Test Score by Race This graph re

7 Oct 27, 2021
A simple script that displays pixel-based animation on GitHub Activity

GitHub Activity Animator This project contains a simple Javascript snippet that produces an animation on your GitHub activity tracker. The project als

16 Nov 15, 2021
Glue is a python project to link visualizations of scientific datasets across many files.

Glue Glue is a python project to link visualizations of scientific datasets across many files. Click on the image for a quick demo: Features Interacti

675 Dec 09, 2022
Joyplots in Python with matplotlib & pandas :chart_with_upwards_trend:

JoyPy JoyPy is a one-function Python package based on matplotlib + pandas with a single purpose: drawing joyplots (a.k.a. ridgeline plots). The code f

Leonardo Taccari 462 Jan 02, 2023
basemap - Plot on map projections (with coastlines and political boundaries) using matplotlib.

Basemap Plot on map projections (with coastlines and political boundaries) using matplotlib. ⚠️ Warning: this package is being deprecated in favour of

Matplotlib Developers 706 Dec 28, 2022
Active Transport Analytics Model (ATAM) is a new strategic transport modelling and data visualization framework for Active Transport as well as emerging micro-mobility modes

{ATAM} Active Transport Analytics Model Active Transport Analytics Model (“ATAM”) is a new strategic transport modelling and data visualization framew

Peter Stephan 0 Jan 12, 2022
Python Package for CanvasXpress JS Visualization Tools

CanvasXpress Python Library About CanvasXpress for Python CanvasXpress was developed as the core visualization component for bioinformatics and system

Dr. Todd C. Brett 5 Nov 07, 2022
Curvipy - The Python package for visualizing curves and linear transformations in a super simple way

Curvipy - The Python package for visualizing curves and linear transformations in a super simple way

Dylan Tintenfich 55 Dec 28, 2022
A command line tool for visualizing CSV/spreadsheet-like data

PerfPlotter Read data from CSV files using pandas and generate interactive plots using bokeh, which can then be embedded into HTML pages and served by

Gino Mempin 0 Jun 25, 2022
This is a sorting visualizer made with Tkinter.

Sorting-Visualizer This is a sorting visualizer made with Tkinter. Make sure you've installed tkinter in your system to use this visualizer pip instal

Vishal Choubey 7 Jul 06, 2022
Missing data visualization module for Python.

missingno Messy datasets? Missing values? missingno provides a small toolset of flexible and easy-to-use missing data visualizations and utilities tha

Aleksey Bilogur 3.4k Dec 29, 2022
This GitHub Repository contains Data Analysis projects that I have completed so far! While most of th project are focused on Data Analysis, some of them are also put here to show off other skills that I have learned.

Welcome to my Data Analysis projects page! This GitHub Repository contains Data Analysis projects that I have completed so far! While most of th proje

Kyle Dini 1 Jan 31, 2022
Generate visualizations of GitHub user and repository statistics using GitHub Actions.

GitHub Stats Visualization Generate visualizations of GitHub user and repository statistics using GitHub Actions. This project is currently a work-in-

JoelImgu 3 Dec 14, 2022
Voilà, install macOS on ANY Computer! This is really and magic easiest way!

OSX-PROXMOX - Run macOS on ANY Computer - AMD & Intel Install Proxmox VE v7.02 - Next, Next & Finish (NNF). Open Proxmox Web Console - Datacenter N

Gabriel Luchina 654 Jan 09, 2023
Frbmclust - Clusterize FRB profiles using hierarchical clustering, plot corresponding parameters distributions

frbmclust Getting Started Clusterize FRB profiles using hierarchical clustering,

3 May 06, 2022
A visualization tool made in Pygame for various pathfinding algorithms.

Pathfinding-Visualizer 🚀 A visualization tool made in Pygame for various pathfinding algorithms. Pathfinding is closely related to the shortest path

Aysha sana 7 Jul 09, 2022
DrawBot lets you draw images taken from the internet on Skribbl.io, Gartic Phone and Paint

DrawBot You don't speak french? No worries, english translation is over here. C'est quoi ? DrawBot est un logiciel codé par V2F qui va prendre possess

V2F 205 Jan 01, 2023
Python+Numpy+OpenGL: fast, scalable and beautiful scientific visualization

Python+Numpy+OpenGL: fast, scalable and beautiful scientific visualization

Glumpy 1.1k Jan 05, 2023