GAT - Graph Attention Network (PyTorch)
💻
+ graphs +
📣
=
❤️
This repo contains a PyTorch implementation of the original GAT paper (
It's aimed at making it easy to start playing and learning about GAT and GNNs in general.
Table of Contents
- What are graph neural networks and GAT?
- Visualizations (Cora and PPI, attention, t-SNE embeddings, entropy histograms)
- Setup
- Usage
- Hardware requirements
- Learning material
What are GNNs?
Graph neural networks are a family of neural networks that are dealing with signals defined over graphs!
Graphs can model many interesting natural phenomena, so you'll see them used everywhere from:
- Computational biology - predicting potent antibiotics like halicin
- Computational pharmacology - predicting drug side effects
- Traffic forecasting - e.g. it's used in Google Maps
- Recommendation systems (used at Pintrest, Uber, Twitter, etc.)
and all the way to particle physics at Large Hedron Collider (LHC), fake news detection and the list goes on and on!
GAT is a representative of spatial (convolutional) GNNs. Since CNNs had a tremendous success in the field of computer vision, researchers decided to generalize it to graphs and so here we are!
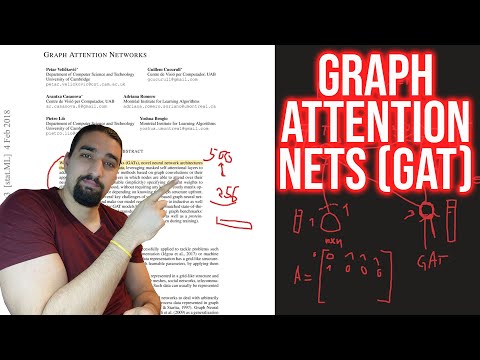
Here is a schematic of GAT's structure:

Cora visualized
You can't just start talking about GNNs without mentioning the single most famous graph dataset - Cora.
Nodes in Cora represent research papers and the links are, you guessed it, citations between those papers.
I've added a utility for visualizing Cora and doing basic network analysis. Here is how Cora looks like:

Node size corresponds to its degree (i.e. the number of in/outgoing edges). Edge thickness roughly corresponds to how "popular" or "connected" that edge is (edge betweennesses is the nerdy term check out the code.)
And here is a plot showing the degree distribution on Cora:

In and out degree plots are the same since we're dealing with an undirected graph.
On the bottom plot (degree distribution) you can see an interesting peak happening in the [2, 4] range. This means that the majority of nodes have a small number of edges but there is 1 node that has 169 edges! (the big green node)
Attention visualized
Once we have a fully-trained GAT model we can visualize the attention that certain "nodes" have learned.
Nodes use attention to decide how to aggregate their neighborhood, enough talk, let's see it:

This is one of Cora's nodes that has the most edges (citations). The colors represent the nodes of the same class. You can clearly see 2 things from this plot:
- The graph is homophilic meaning similar nodes (nodes with same class) tend to cluster together.
- Edge thickness on this chart is a function of attention, and since they are all of the same thickness, GAT basically learned to do something similar to GCN!
Similar rules hold for smaller neighborhoods. Also notice the self edges:


On the other hand PPI is learning much more interesting attention patterns:


On the left we can see that 6 neighbors are receiving a non-negligible amount of attention and on the right we can see that all of the attention is focused onto a single neighbor.
Finally 2 more interesting patterns - a strong self edge on the left and on the right we can see that a single neighbor is receiving a bulk of attention whereas the rest is equally distributed across the rest of the neighborhood:


Important note: all of the PPI visualizations are only possible for the first GAT layer. For some reason the attention coefficients for the second and third layers are almost all 0s (even though I achieved the published results).
Entropy histograms
Another way to understand that GAT isn't learning interesting attention patterns on Cora (i.e. that it's learning const attention) is by treating the node neighborhood's attention weights as a probability distribution, calculating the entropy, and accumulating the info across every node's neighborhood.
We'd love GAT's attention distributions to be skewed. You can see in orange how the histogram looks like for ideal uniform distributions, and you can see in light blue the learned distributions - they are exactly the same!


I've plotted only a single attention head from the first layer (out of 8) because they're all the same!
On the other hand PPI is learning much more interesting attention patterns:

As expected, the uniform distribution entropy histogram lies to the right (orange) since uniform distributions have the highest entropy.
Analyzing Cora's embedding space (t-SNE)
Ok, we've seen attention! What else is there to visualize? Well, let's visualize the learned embeddings from GAT's last layer. The output of GAT is a tensor of shape = (2708, 7) where 2708 is the number of nodes in Cora and 7 is the number of classes. Once we project those 7-dim vectors into 2D, using t-SNE, we get this:

We can see that the nodes with the same label/class are roughly clustered together - with these representations it's easy to train a simple classifier on top that will tell us which class the node belongs to.
Note: I've tried UMAP as well but didn't get nicer results + it has a lot of dependencies if you want to use their plot util.
Setup
So we talked about what GNNs are, and what they can do for you (among other things).
Let's get this thing running! Follow the next steps:
git clone https://github.com/gordicaleksa/pytorch-GAT- Open Anaconda console and navigate into project directory
cd path_to_repo - Run
conda env createfrom project directory (this will create a brand new conda environment). - Run
activate pytorch-gat(for running scripts from your console or setup the interpreter in your IDE)
That's it! It should work out-of-the-box executing environment.yml file which deals with dependencies.
PyTorch pip package will come bundled with some version of CUDA/cuDNN with it, but it is highly recommended that you install a system-wide CUDA beforehand, mostly because of the GPU drivers. I also recommend using Miniconda installer as a way to get conda on your system. Follow through points 1 and 2 of this setup and use the most up-to-date versions of Miniconda and CUDA/cuDNN for your system.
Usage
Option 1: Jupyter Notebook
Just run jupyter notebook from you Anaconda console and it will open up a session in your default browser.
Open The Annotated GAT.ipynb and you're ready to play!
Note: if you get DLL load failed while importing win32api: The specified module could not be found
Just do pip uninstall pywin32 and then either pip install pywin32 or conda install pywin32 should fix it!
Option 2: Use your IDE of choice
You just need to link the Python environment you created in the setup section.
Training GAT
FYI, my GAT implementation achieves the published results:
- On Cora I get the
82-83%accuracy on test nodes - On PPI I achieved the
0.973micro-F1 score (and actually even higher)
Everything needed to train GAT on Cora is already setup. To run it (from console) just call:
python training_script_cora.py
You could also potentially:
- add the
--should_visualize- to visualize your graph data - add the
--should_test- to evaluate GAT on the test portion of the data - add the
--enable_tensorboard- to start saving metrics (accuracy, loss)
The code is well commented so you can (hopefully) understand how the training itself works.
The script will:
- Dump checkpoint *.pth models into
models/checkpoints/ - Dump the final *.pth model into
models/binaries/ - Save metrics into
runs/, just runtensorboard --logdir=runsfrom your Anaconda to visualize it - Periodically write some training metadata to the console
Same goes for training on PPI, just run python training_script_ppi.py. PPI is much more GPU-hungry so if you don't have a strong GPU with at least 8 GBs you'll need to add the --force_cpu flag to train GAT on CPU. You can alternatively try reducing the batch size to 1 or making the model slimmer.
You can visualize the metrics during the training, by calling tensorboard --logdir=runs from your console and pasting the http://localhost:6006/ URL into your browser:


Note: Cora's train split seems to be much harder than the validation and test splits looking at the loss and accuracy metrics.
Having said that most of the fun actually lies in the playground.py script.
Tip for understanding the code
I've added 3 GAT implementations - some are conceptually easier to understand some are more efficient. The most interesting and hardest one to understand is implementation 3. Implementation 1 and implementation 2 differ in subtle details but basically do the same thing.
Advice on how to approach the code:
- Understand the implementation #2 first
- Check out the differences it has compared to implementation #1
- Finally, tackle the implementation #3
Profiling GAT
If you want to profile the 3 implementations just set the the playground_fn variable to PLAYGROUND.PROFILE_GAT in playground.py.
There are 2 params you may care about:
store_cache- set toTrueif you wish to save the memory/time profiling results after you've run itskip_if_profiling_info_cached- set toTrueif you want to pull the profiling info from cache
The results will get stored in data/ in memory.dict and timing.dict dictionaries (pickle).
Note: implementation #3 is by far the most optimized one - you can see the details in the code.
I've also added profile_sparse_matrix_formats if you want to get some familiarity with different matrix sparse formats like COO, CSR, CSC, LIL, etc.
Visualization tools
If you want to visualize t-SNE embeddings, attention or embeddings set the playground_fn variable to PLAYGROUND.VISUALIZE_GAT and set the visualization_type to:
VisualizationType.ATTENTION- if you wish to visualize attention across node neighborhoodsVisualizationType.EMBEDDING- if you wish to visualize the embeddings (via t-SNE)VisualizationType.ENTROPY- if you wish to visualize the entropy histograms
And you'll get crazy visualizations like these ones (VisualizationType.ATTENTION option):


On the left you can see the node with the highest degree in the whole Cora dataset.
If you're wondering about why these look like a circle, it's because I've used the layout_reingold_tilford_circular layout which is particularly well suited for tree like graphs (since we're visualizing a node and its neighbors this subgraph is effectively a m-ary tree).
But you can also use different drawing algorithms like kamada kawai (on the right), etc.
Feel free to go through the code and play with plotting attention from different GAT layers, plotting different node neighborhoods or attention heads. You can also easily change the number of layers in your GAT, although shallow GNNs tend to perform the best on small-world, homophilic graph datasets.
If you want to visualize Cora/PPI just set the playground_fn to PLAYGROUND.VISUALIZE_DATASET and you'll get the results from this README.
Hardware requirements
HW requirements are highly dependent on the graph data you'll use. If you just want to play with Cora, you're good to go with a 2+ GBs GPU.
It takes (on Cora citation network):
- ~10 seconds to train GAT on my RTX 2080 GPU
- 1.5 GBs of VRAM memory is reserved (PyTorch's caching overhead - far less is allocated for the actual tensors)
- The model itself has only 365 KBs!
Compare this to hardware needed even for the smallest of transformers!
On the other hand the PPI dataset is much more GPU-hungry. You'll need a GPU with 8+ GBs of VRAM, or you can reduce the batch size to 1 and make the model "slimmer" and thus try to reduce the VRAM consumption.
Future todos:
- Figure out why are the attention coefficients equal to 0 (for the PPI dataset, second and third layer)
- Potentially add an implementation leveraging PyTorch's
sparse API
If you have an idea of how to implement GAT using PyTorch's sparse API please feel free to submit a PR. I personally had difficulties with their API, it's in beta, and it's questionable whether it's at all possible to make an implementation as efficient as my implementation 3 using it.
Secondly, I'm still not sure why is GAT achieving reported results on PPI while there are some obvious numeric problems in deeper layers as manifested by all attention coefficients being equal to 0.
Learning material
If you're having difficulties understanding GAT I did an in-depth overview of the paper in this video:
I also made a walk-through video of this repo (focusing on the potential pain points), and a blog for getting started with Graph ML in general!
I have some more videos which could further help you understand GNNs:
- My overview of the GCN paper
- My overview of the GraphSAGE paper
- My overview of the PinSage paper
- My overview of Temporal Graph Networks (TGN)
Acknowledgements
I found these repos useful (while developing this one):
- official GAT and GCN
- PyTorch Geometric
- DeepInf and pyGAT
Citation
If you find this code useful, please cite the following:
@misc{Gordić2020PyTorchGAT,
  author = {Gordić, Aleksa},
  title = {pytorch-GAT},
  year = {2020},
  publisher = {GitHub},
  journal = {GitHub repository},
  howpublished = {\url{https://github.com/gordicaleksa/pytorch-GAT}},
}

 395 Dec 19, 2022
 35 Nov 14, 2022
 51 Dec 13, 2022
 49 Nov 22, 2022
 5 Jun 30, 2022
 10 Nov 03, 2022
 109 Dec 29, 2022
 7 Oct 31, 2021
 4 Nov 30, 2022
 1 Jun 30, 2022
 2.6k Jan 08, 2023
 67 Nov 14, 2022
 1 Nov 29, 2022
 4 Jul 12, 2022
 7 Oct 18, 2022
 80 Dec 27, 2022
 45 Dec 26, 2022
 3 Apr 10, 2022
 1k Dec 25, 2022