Uniform Manifold Approximation and Projection

Overview

pypi_version pypi_downloads

conda_version conda_downloads

License build_status Coverage

Docs joss_paper

UMAP

Uniform Manifold Approximation and Projection (UMAP) is a dimension reduction technique that can be used for visualisation similarly to t-SNE, but also for general non-linear dimension reduction. The algorithm is founded on three assumptions about the data:

  1. The data is uniformly distributed on a Riemannian manifold;
  2. The Riemannian metric is locally constant (or can be approximated as such);
  3. The manifold is locally connected.

From these assumptions it is possible to model the manifold with a fuzzy topological structure. The embedding is found by searching for a low dimensional projection of the data that has the closest possible equivalent fuzzy topological structure.

The details for the underlying mathematics can be found in our paper on ArXiv:

McInnes, L, Healy, J, UMAP: Uniform Manifold Approximation and Projection for Dimension Reduction, ArXiv e-prints 1802.03426, 2018

The important thing is that you don't need to worry about that—you can use UMAP right now for dimension reduction and visualisation as easily as a drop in replacement for scikit-learn's t-SNE.

Documentation is available via Read the Docs.

New: this package now also provides support for densMAP. The densMAP algorithm augments UMAP to preserve local density information in addition to the topological structure of the data. Details of this method are described in the following paper:

Narayan, A, Berger, B, Cho, H, Density-Preserving Data Visualization Unveils Dynamic Patterns of Single-Cell Transcriptomic Variability, bioRxiv, 2020

Installing

UMAP depends upon scikit-learn, and thus scikit-learn's dependencies such as numpy and scipy. UMAP adds a requirement for numba for performance reasons. The original version used Cython, but the improved code clarity, simplicity and performance of Numba made the transition necessary.

Requirements:

  • Python 3.6 or greater
  • numpy
  • scipy
  • scikit-learn
  • numba

Recommended packages:

  • pynndescent
  • For plotting
    • matplotlib
    • datashader
    • holoviews
  • for Parametric UMAP
    • tensorflow > 2.0.0

Installing pynndescent can significantly increase performance, and in later versions it will become a hard dependency.

Install Options

Conda install, via the excellent work of the conda-forge team:

conda install -c conda-forge umap-learn

The conda-forge packages are available for Linux, OS X, and Windows 64 bit.

PyPI install, presuming you have numba and sklearn and all its requirements (numpy and scipy) installed:

pip install umap-learn

If you wish to use the plotting functionality you can use

pip install umap-learn[plot]

to install all the plotting dependencies.

If you wish to use Parametric UMAP, you need to install Tensorflow, which can be installed either using the instructions at https://www.tensorflow.org/install (reccomended) or using

pip install umap-learn[parametric_umap]

for a CPU-only version of Tensorflow.

If pip is having difficulties pulling the dependencies then we'd suggest installing the dependencies manually using anaconda followed by pulling umap from pip:

conda install numpy scipy
conda install scikit-learn
conda install numba
pip install umap-learn

For a manual install get this package:

wget https://github.com/lmcinnes/umap/archive/master.zip
unzip master.zip
rm master.zip
cd umap-master

Install the requirements

sudo pip install -r requirements.txt

or

conda install scikit-learn numba

Install the package

python setup.py install

How to use UMAP

The umap package inherits from sklearn classes, and thus drops in neatly next to other sklearn transformers with an identical calling API.

import umap
from sklearn.datasets import load_digits

digits = load_digits()

embedding = umap.UMAP().fit_transform(digits.data)

There are a number of parameters that can be set for the UMAP class; the major ones are as follows:

  • n_neighbors: This determines the number of neighboring points used in local approximations of manifold structure. Larger values will result in more global structure being preserved at the loss of detailed local structure. In general this parameter should often be in the range 5 to 50, with a choice of 10 to 15 being a sensible default.
  • min_dist: This controls how tightly the embedding is allowed compress points together. Larger values ensure embedded points are more evenly distributed, while smaller values allow the algorithm to optimise more accurately with regard to local structure. Sensible values are in the range 0.001 to 0.5, with 0.1 being a reasonable default.
  • metric: This determines the choice of metric used to measure distance in the input space. A wide variety of metrics are already coded, and a user defined function can be passed as long as it has been JITd by numba.

An example of making use of these options:

import umap
from sklearn.datasets import load_digits

digits = load_digits()

embedding = umap.UMAP(n_neighbors=5,
                      min_dist=0.3,
                      metric='correlation').fit_transform(digits.data)

UMAP also supports fitting to sparse matrix data. For more details please see the UMAP documentation

Benefits of UMAP

UMAP has a few signficant wins in its current incarnation.

First of all UMAP is fast. It can handle large datasets and high dimensional data without too much difficulty, scaling beyond what most t-SNE packages can manage. This includes very high dimensional sparse datasets. UMAP has successfully been used directly on data with over a million dimensions.

Second, UMAP scales well in embedding dimension—it isn't just for visualisation! You can use UMAP as a general purpose dimension reduction technique as a preliminary step to other machine learning tasks. With a little care it partners well with the hdbscan clustering library (for more details please see Using UMAP for Clustering).

Third, UMAP often performs better at preserving some aspects of global structure of the data than most implementations of t-SNE. This means that it can often provide a better "big picture" view of your data as well as preserving local neighbor relations.

Fourth, UMAP supports a wide variety of distance functions, including non-metric distance functions such as cosine distance and correlation distance. You can finally embed word vectors properly using cosine distance!

Fifth, UMAP supports adding new points to an existing embedding via the standard sklearn transform method. This means that UMAP can be used as a preprocessing transformer in sklearn pipelines.

Sixth, UMAP supports supervised and semi-supervised dimension reduction. This means that if you have label information that you wish to use as extra information for dimension reduction (even if it is just partial labelling) you can do that—as simply as providing it as the y parameter in the fit method.

Seventh, UMAP supports a variety of additional experimental features including: an "inverse transform" that can approximate a high dimensional sample that would map to a given position in the embedding space; the ability to embed into non-euclidean spaces including hyperbolic embeddings, and embeddings with uncertainty; very preliminary support for embedding dataframes also exists.

Finally, UMAP has solid theoretical foundations in manifold learning (see our paper on ArXiv). This both justifies the approach and allows for further extensions that will soon be added to the library.

Performance and Examples

UMAP is very efficient at embedding large high dimensional datasets. In particular it scales well with both input dimension and embedding dimension. For the best possible performance we recommend installing the nearest neighbor computation library pynndescent . UMAP will work without it, but if installed it will run faster, particularly on multicore machines.

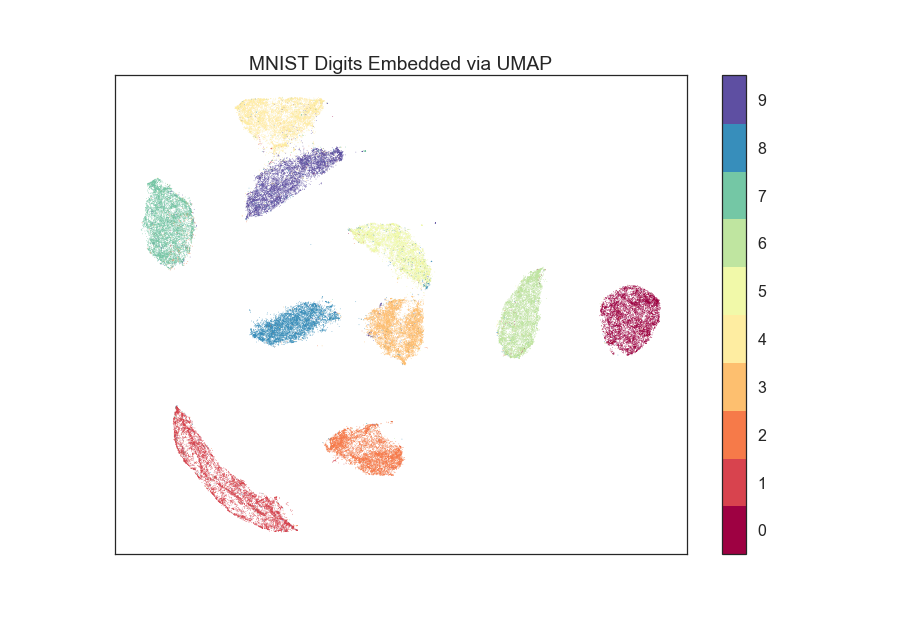
For a problem such as the 784-dimensional MNIST digits dataset with 70000 data samples, UMAP can complete the embedding in under a minute (as compared with around 45 minutes for scikit-learn's t-SNE implementation). Despite this runtime efficiency, UMAP still produces high quality embeddings.

The obligatory MNIST digits dataset, embedded in 42 seconds (with pynndescent installed and after numba jit warmup) using a 3.1 GHz Intel Core i7 processor (n_neighbors=10, min_dist=0.001):

UMAP embedding of MNIST digits

The MNIST digits dataset is fairly straightforward, however. A better test is the more recent "Fashion MNIST" dataset of images of fashion items (again 70000 data sample in 784 dimensions). UMAP produced this embedding in 49 seconds (n_neighbors=5, min_dist=0.1):

UMAP embedding of "Fashion MNIST"

The UCI shuttle dataset (43500 sample in 8 dimensions) embeds well under correlation distance in 44 seconds (note the longer time required for correlation distance computations):

UMAP embedding the UCI Shuttle dataset

The following is a densMAP visualization of the MNIST digits dataset with 784 features based on the same parameters as above (n_neighbors=10, min_dist=0.001). densMAP reveals that the cluster corresponding to digit 1 is noticeably denser, suggesting that there are fewer degrees of freedom in the images of 1 compared to other digits.

densMAP embedding of the MNIST dataset

Plotting

UMAP includes a subpackage umap.plot for plotting the results of UMAP embeddings. This package needs to be imported separately since it has extra requirements (matplotlib, datashader and holoviews). It allows for fast and simple plotting and attempts to make sensible decisions to avoid overplotting and other pitfalls. An example of use:

import umap
import umap.plot
from sklearn.datasets import load_digits

digits = load_digits()

mapper = umap.UMAP().fit(digits.data)
umap.plot.points(mapper, labels=digits.target)

The plotting package offers basic plots, as well as interactive plots with hover tools and various diagnostic plotting options. See the documentation for more details.

Parametric UMAP

Parametric UMAP provides support for training a neural network to learn a UMAP based transformation of data. This can be used to support faster inference of new unseen data, more robust inverse transforms, autoencoder versions of UMAP and semi-supervised classification (particularly for data well separated by UMAP and very limited amounts of labelled data). See the documentation of Parametric UMAP or the example notebooks for more.

densMAP

The densMAP algorithm augments UMAP to additionally preserve local density information in addition to the topological structure captured by UMAP. One can easily run densMAP using the umap package by setting the densmap input flag:

embedding = umap.UMAP(densmap=True).fit_transform(data)

This functionality is built upon the densMAP implementation provided by the developers of densMAP, who also contributed to integrating densMAP into the umap package.

densMAP inherits all of the parameters of UMAP. The following is a list of additional parameters that can be set for densMAP:

  • dens_frac: This determines the fraction of epochs (a value between 0 and 1) that will include the density-preservation term in the optimization objective. This parameter is set to 0.3 by default. Note that densMAP switches density optimization on after an initial phase of optimizing the embedding using UMAP.
  • dens_lambda: This determines the weight of the density-preservation objective. Higher values prioritize density preservation, and lower values (closer to zero) prioritize the UMAP objective. Setting this parameter to zero reduces the algorithm to UMAP. Default value is 2.0.
  • dens_var_shift: Regularization term added to the variance of local densities in the embedding for numerical stability. We recommend setting this parameter to 0.1, which consistently works well in many settings.
  • output_dens: When this flag is True, the call to fit_transform returns, in addition to the embedding, the local radii (inverse measure of local density defined in the densMAP paper) for the original dataset and for the embedding. The output is a tuple (embedding, radii_original, radii_embedding). Note that the radii are log-transformed. If False, only the embedding is returned. This flag can also be used with UMAP to explore the local densities of UMAP embeddings. By default this flag is False.

For densMAP we recommend larger values of n_neighbors (e.g. 30) for reliable estimation of local density.

An example of making use of these options (based on a subsample of the mnist_784 dataset):

import umap
from sklearn.datasets import fetch_openml
from sklearn.utils import resample

digits = fetch_openml(name='mnist_784')
subsample, subsample_labels = resample(digits.data, digits.target, n_samples=7000,
                                       stratify=digits.target, random_state=1)

embedding, r_orig, r_emb = umap.UMAP(densmap=True, dens_lambda=2.0, n_neighbors=30,
                                     output_dens=True).fit_transform(subsample)

See the documentation for more details.

Help and Support

Documentation is at Read the Docs. The documentation includes a FAQ that may answer your questions. If you still have questions then please open an issue and I will try to provide any help and guidance that I can.

Citation

If you make use of this software for your work we would appreciate it if you would cite the paper from the Journal of Open Source Software:

@article{mcinnes2018umap-software,
  title={UMAP: Uniform Manifold Approximation and Projection},
  author={McInnes, Leland and Healy, John and Saul, Nathaniel and Grossberger, Lukas},
  journal={The Journal of Open Source Software},
  volume={3},
  number={29},
  pages={861},
  year={2018}
}

If you would like to cite this algorithm in your work the ArXiv paper is the current reference:

@article{2018arXivUMAP,
     author = {{McInnes}, L. and {Healy}, J. and {Melville}, J.},
     title = "{UMAP: Uniform Manifold Approximation
     and Projection for Dimension Reduction}",
     journal = {ArXiv e-prints},
     archivePrefix = "arXiv",
     eprint = {1802.03426},
     primaryClass = "stat.ML",
     keywords = {Statistics - Machine Learning,
                 Computer Science - Computational Geometry,
                 Computer Science - Learning},
     year = 2018,
     month = feb,
}

Additionally, if you use the densMAP algorithm in your work please cite the following reference:

@article {NBC2020,
    author = {Narayan, Ashwin and Berger, Bonnie and Cho, Hyunghoon},
    title = {Density-Preserving Data Visualization Unveils Dynamic Patterns of Single-Cell Transcriptomic Variability},
    journal = {bioRxiv},
    year = {2020},
    doi = {10.1101/2020.05.12.077776},
    publisher = {Cold Spring Harbor Laboratory},
    URL = {https://www.biorxiv.org/content/early/2020/05/14/2020.05.12.077776},
    eprint = {https://www.biorxiv.org/content/early/2020/05/14/2020.05.12.077776.full.pdf},
}

If you use the Parametric UMAP algorithm in your work please cite the following reference:

@article {NBC2020,
    author = {Sainburg, Tim and McInnes, Leland and Gentner, Timothy Q.},
    title = {Parametric UMAP: learning embeddings with deep neural networks for representation and semi-supervised learning},
    journal = {ArXiv e-prints},
    archivePrefix = "arXiv",
    eprint = {},
    primaryClass = "stat.ML",
    keywords = {Statistics - Machine Learning,
                Computer Science - Computational Geometry,
                Computer Science - Learning},
    year = 2020,
    }

License

The umap package is 3-clause BSD licensed.

We would like to note that the umap package makes heavy use of NumFOCUS sponsored projects, and would not be possible without their support of those projects, so please consider contributing to NumFOCUS.

Contributing

Contributions are more than welcome! There are lots of opportunities for potential projects, so please get in touch if you would like to help out. Everything from code to notebooks to examples and documentation are all equally valuable so please don't feel you can't contribute. To contribute please fork the project make your changes and submit a pull request. We will do our best to work through any issues with you and get your code merged into the main branch.

Comments
  • Wierd results on dataset

    Wierd results on dataset

    Tried it on some Swedish parlament voting data. Did a notebook comparing it to t-SNE that works fine, but umap just produces one big blob. Tried some different parameters without any luck, but honestly I have no clue what either of the parameters does :).

    See notebook for more info (if you run it you will have nice interactive plots, but i also added a static plot since the interactive is stripped from the gist)

    https://gist.github.com/maxberggren/56efa53776f42755b83261c54081496e

    opened by maxberggren 25
  • RecursionError

    RecursionError

    Hi, thanks for the great package.

    I have a dataset which has 200000 rows and 15 columns. I tried to apply UMAP as following

    embedding = umap.UMAP(n_neighbors=5, min_dist=0.3, metric='correlation').fit_transform(data)

    After 10 seconds, I got following exceptions :

    • RecursionError: maximum recursion depth exceeded while calling a Python object
    • return make_angular_tree(data, indices, rng_state, leaf_size) SystemError: CPUDispatcher(<function angular_random_projection_split at 0x000001C8260D6378>) returned a result with an error set

    I set the system recursion limit to 10000 as below and tried again but then python exited with a code like -143537645 meaning exited with error.

    sys.setrecursionlimit(10000)

    Is there any solution, workaround or anything I can do for this problem?

    Thanks.

    opened by sametdumankaya 23
  • Attribute Error

    Attribute Error

    Hi there, these are my system specs: macOS Sierra 10.12.3 (16D32)

    I have installed umap through pip. When I try to run it this the error message that comes up. I'm unsure what the problem is, any ideas?

    ---------------------------------------------------------------------------
    AttributeError                            Traceback (most recent call last)
    <ipython-input-10-68ef34dfa695> in <module>()
         16         umap_mfccs = get_scaled_umap_embeddings(mfcc_features,
         17                                                 neighbours,
    ---> 18                                                 distances)
         19         umap_embeddings_mfccs.append(umap_mfccs)
         20 
    
    <ipython-input-10-68ef34dfa695> in get_scaled_umap_embeddings(features, neighbour, distance)
          1 def get_scaled_umap_embeddings(features, neighbour, distance):
          2 
    ----> 3     embedding = umap.UMAP(n_neighbors=neighbour,
          4                           min_dist = distance,
          5                           metric = 'correlation').fit_transform(features)
    
    AttributeError: module 'umap' has no attribute 'UMAP'
    
    
    opened by Jhard01 23
  • Stuck at constructing embedding?

    Stuck at constructing embedding?

    I currently have a dataset with more than 10 million rows of data and 384 dimensions. I use PCA to reduce the 384 dimensions to 10, and then apply UMAP via the BertTopic library.

    To avoid running into memory issues, I am using a machine with 1TB of RAM and 128 cores. However, it seems that the process hang at "Construct embedding", and only about 500GB of RAM is being used (so not a memory issue).

    Here are the code and verbose:

    
    embeddings = np.load('embeddings.npy')
    
    pca = PCA(n_components=10)
    embeddings_pca = pca.fit_transform(embeddings)
    
    vectorizer_model = CountVectorizer(ngram_range=(1, 2), stop_words="english")
    
    umap_model = UMAP(n_neighbors=15, n_components=5, min_dist=0.0, metric='cosine', low_memory = True, verbose=True)
    
    # Setting HDBSCAN model
    hdbscan_model = HDBSCAN(min_cluster_size=10, metric='euclidean', cluster_selection_method='eom', prediction_data=True)
    
    topic_model = BERTopic(umap_model = umap_model, hdbscan_model=hdbscan_model,  verbose=True, seed_topic_list=seed_topic_list, low_memory=True, calculate_probabilities=True, vectorizer_model=vectorizer_model)
    
    #topics, probs = topic_model.fit_transform(docs)
    
    topic_model = topic_model.fit(docs, embeddings_pca)
    
    UMAP(angular_rp_forest=True, dens_frac=0.0, dens_lambda=0.0, metric='cosine',
         min_dist=0.0, n_components=5, verbose=True)
    Construct fuzzy simplicial set
    Tue Sep 28 11:33:15 2021 Finding Nearest Neighbors
    Tue Sep 28 11:33:15 2021 Building RP forest with 64 trees
    Tue Sep 28 11:34:42 2021 NN descent for 23 iterations
    	 1  /  23
    	 2  /  23
    	Stopping threshold met -- exiting after 2 iterations
    Tue Sep 28 11:49:29 2021 Finished Nearest Neighbor Search
    Tue Sep 28 11:50:33 2021 Construct embedding
    

    If I understand correctly, the most memory consuming step should be nearest neighbour search (which it completed with no issue)? How come does it stuck at constructing embeddings?

    opened by ginward 22
  • Numba warnings

    Numba warnings

    First I want to thank you for sharing this great work. It is very useful for me. The first time I execute UMAP fit and transform I get some numba warnings. They do not seem to be critical, but they are somewhat disturbing.

    numba.__version__ '0.44.0'

    sys.version '3.7.3 (default, Mar 27 2019, 22:11:17) \n[GCC 7.3.0]'

    reducer = umap.UMAP(random_state=42)
    reducer.fit(X)
    Y = reducer.transform(X)
    
    /home/mbr085/anaconda3/envs/divisivegater/lib/python3.7/site-packages/umap/umap_.py:349: NumbaWarning: 
    Compilation is falling back to object mode WITH looplifting enabled because Function "fuzzy_simplicial_set" failed type inference due to: Untyped global name 'nearest_neighbors': cannot determine Numba type of <class 'function'>
    
    File "../../../../../anaconda3/envs/divisivegater/lib/python3.7/site-packages/umap/umap_.py", line 467:
    def fuzzy_simplicial_set(
        <source elided>
        if knn_indices is None or knn_dists is None:
            knn_indices, knn_dists, _ = nearest_neighbors(
            ^
    
      @numba.jit()
    /home/mbr085/anaconda3/envs/divisivegater/lib/python3.7/site-packages/numba/compiler.py:725: NumbaWarning: Function "fuzzy_simplicial_set" was compiled in object mode without forceobj=True.
    
    File "../../../../../anaconda3/envs/divisivegater/lib/python3.7/site-packages/umap/umap_.py", line 350:
    @numba.jit()
    def fuzzy_simplicial_set(
    ^
    
      self.func_ir.loc))
    /home/mbr085/anaconda3/envs/divisivegater/lib/python3.7/site-packages/numba/compiler.py:734: NumbaDeprecationWarning: 
    Fall-back from the nopython compilation path to the object mode compilation path has been detected, this is deprecated behaviour.
    
    For more information visit http://numba.pydata.org/numba-doc/latest/reference/deprecation.html#deprecation-of-object-mode-fall-back-behaviour-when-using-jit
    
    File "../../../../../anaconda3/envs/divisivegater/lib/python3.7/site-packages/umap/umap_.py", line 350:
    @numba.jit()
    def fuzzy_simplicial_set(
    ^
    
      warnings.warn(errors.NumbaDeprecationWarning(msg, self.func_ir.loc))
    
    Good Reads 
    opened by mbr085 22
  • Break out inner loop of optimize_layout function

    Break out inner loop of optimize_layout function

    ...so numba can parallelize it effectively across all cores of a machine.

    During benchmarking, I found that numba was not parallelizing optimize_layout, which is the most compute intensive part of UMAP. By extracting the code that runs for each epoch into its own function and decorating with numba's parallel=True I found that the computation can take advantage of all cores in a machine.

    For example, running locally on a 4-core Mac I found one benchmark (of optimize_layout) went from ~110s to ~45s. And on a 16-core Linux box, the UMAP step of Scanpy went from ~206s to ~73s (for 130K rows).

    opened by tomwhite 21
  • Implement inverse transform

    Implement inverse transform

    I implemented an inverse transform allowing a user to find vectors in data space corresponding to points in embedding space. The basic algorithm is the same as forward UMAP except that the simplicial set is based on a Delaunay complex rather than a Vietoris-Rips complex to provide for smooth behavior in the gaps between clusters. However, this means that inverse_transform(transform(points)) != points in general.

    It was necessary to modify optimize_layout to allow for non-Eucldiean distance metrics in the "embedding" space so that it could be used backwards. It is also now possible to choose whether the used membershhip function is for the input set or the output set. As a side effect, it is now possible to use UMAP to embed data onto a torus or a sphere (or any manifold for which you define a distance and gradient).

    Example scripts for inverse transformation and embedding onto a torus or a sphere are in the examples directory.

    This implementation is still a little rough but is a proof of concept. Currently, only the euclidean and haversine metrics are supported. Functions returning the gradient of other metrics are still needed.

    Embedding of the sklearn digits dataset onto a torus torus

    Embedding of the sklearn digits dataset onto a sphere sphere

    Inverse transform of a grid of points (shown as black xs) back into data space. Dataset is MNIST. Some points look like simple pixel-wise averages of neighboring points. The sharpness of generated vectors increases with higher values of n_epoch. inverse_transform

    opened by josephcourtney 20
  • Converging to a single point

    Converging to a single point

    I'm using UMAP to embed a bunch of 128 dimensional face embeddings generated by a neural net.

    As I increase the number of embeddings (I have 3M total) the output from UMAP converges to a single point in the center surrounded by a sparse cloud around it. How can I fix this? Here are some examples from fewer samples to more samples. n = 73728, 114688, 172032, 196608, 245760

    73728 114688 172032 196608 245760

    opened by kylemcdonald 17
  • Add a fast way to compute knn_indices

    Add a fast way to compute knn_indices

    Tested on a [50k, 50k] distance matrix computed on 50k np.random.normal points where this runs in 6.8s-7.0s on a 120 core machine whereas the old code takes 245s.

    opened by sleighsoft 16
  • Are euclidian distances interpretable in the embedding?

    Are euclidian distances interpretable in the embedding?

    Hi,

    I have a couple of questions regarding the interpretability of the results obtained with UMAP. I apologize if the questions are too trivial and should be posted elsewhere.

    Third, UMAP often performs better at preserving aspects of global structure of the data than t-SNE. This means that it can often provide a better "big picture" view of your data as well as preserving local neighbor relations.

    I was wondering whether euclidian distances in the embedding are interpretable. Taking the MNIST example:

    MNIST example

    Does it make sense to say that the digit "3" is as distant to "0" as it is from "1"? Or that because the area of the cluster of "1"s is larger than the area of the cluster of "8"s, that there is more variability in "1"s than there is in "8"s?

    Is there any way of interpreting of the axes mean, i.e., if we were to take a random point in the 2D space, could we apply an inverse transformation to figure out what the N-D object would've looked like?

    Thank you for your awesome project!

    Good Reads 
    opened by dangom 16
  • Intermittent ZeroDivisionError: division by zero

    Intermittent ZeroDivisionError: division by zero

    This is a fantastic library, thanks very much for your great work. Periodically though, I'm getting a ZeroDivisionError: division by zero while building a UMAP projection. My data doesn't change, nor does the way I call the UMAP constructor:

    model = umap.UMAP(n_neighbors=25, min_dist=0.00001, metric='correlation')
    fit_model = model.fit_transform( np.array(image_vectors) )
    

    Once in a while (maybe 5% of runs) this throws the following trace (umap version 0.1.5):

    File "imageplot.py", line 278, in <module>
        Imageplot(image_dir=sys.argv[1], output_dir='output')
      File "imageplot.py", line 30, in __init__
        self.create_2d_projection()
      File "imageplot.py", line 148, in create_2d_projection
        model = self.build_model(image_vectors)
      File "imageplot.py", line 175, in build_model
        return model.fit_transform( np.array(image_vectors) )
      File "/Users/yaledhlab/anaconda3/lib/python3.6/site-packages/umap/umap_.py", line 1402, in fit_transform
        self.fit(X)
      File "/Users/yaledhlab/anaconda3/lib/python3.6/site-packages/umap/umap_.py", line 1361, in fit
        self.verbose
      File "/Users/yaledhlab/anaconda3/lib/python3.6/site-packages/umap/umap_.py", line 385, in rptree_leaf_array
        angular=angular)
      File "/Users/yaledhlab/anaconda3/lib/python3.6/site-packages/umap/umap_.py", line 310, in make_tree
        angular)
      File "/Users/yaledhlab/anaconda3/lib/python3.6/site-packages/umap/umap_.py", line 315, in make_tree
        angular)
      File "/Users/yaledhlab/anaconda3/lib/python3.6/site-packages/umap/umap_.py", line 315, in make_tree
        angular)
      File "/Users/yaledhlab/anaconda3/lib/python3.6/site-packages/umap/umap_.py", line 310, in make_tree
        angular)
      File "/Users/yaledhlab/anaconda3/lib/python3.6/site-packages/umap/umap_.py", line 310, in make_tree
        angular)
      File "/Users/yaledhlab/anaconda3/lib/python3.6/site-packages/umap/umap_.py", line 310, in make_tree
        angular)
      File "/Users/yaledhlab/anaconda3/lib/python3.6/site-packages/umap/umap_.py", line 301, in make_tree
        rng_state)
    ZeroDivisionError: division by zero
    

    I took a quick look at the make_tree function but that didn't show much--the real problem seems to be swallowed in the stacktrace by the recursion. Do you have an idea what might cause this? I'll upgrade to the latest master and see if the problem continues.

    opened by duhaime 16
  • Support sparse inputs for Parametric UMAP

    Support sparse inputs for Parametric UMAP

    If I'm not mistaken, embedder.fit_transform (especially parts of construct_edge_dataset) assumes a dense input matrix. I can try to adjust this function and follow the colab notebook in the tutorial to work with sparse data easily enough, but could this functionality could be enabled by default?

    opened by jett-crowdis 0
  • uMAP code error in example exercise

    uMAP code error in example exercise

    I copied and pasted the code for the examples so as to follow along, confirm the code worked and to use it as a base for my own data. The Penguin example works fine, however, when I move on to the "digits" example, I get the following errors. As I am a newbie to Python, I don't known how to go about resolving the error. Furthermore, as it is the code for the sample exercise, it may require correcting and/or a note in Frequently Asked Questions.

    image

    Thank you.

    Regards,

    Rick

    documentation 
    opened by Dyn-Walker 2
  • Fixed unclear exception message?

    Fixed unclear exception message?

    Hi! Thanks for the work, Ive recently tried you guys' packages. I found the exception message in the plot.py:31 is kind of unclear, it would be better to assign Exception to a variable and insert that inside ImportError's exception message. Should I make a pull request on this? Thanks

    opened by author31 0
  • Embedding interpretability using SHAP

    Embedding interpretability using SHAP

    Hi,

    I've been using umap-learn for a couple of years now, so I just wanted to thank you all for the hard work you put in the package. We find some pretty intriguing insights using it in the chemometrics field.

    I'm aware that there are model-agnostic explainers in the field of Machine Learning, such as Shapley Values and LIME, that can help explain how much features contribute to the model's prediction. In the case of Shapley values, these tell you how much each feature contribution deviates from the 'average prediction' (taking the average of all features and predict on that). Here is an (article) explaining how Shapley Values can be applied in the Data Science field despite its origin coming from Game Theory. The beauty of Shapley values is that it is model agnostic, it only asks for an objective function that can project all the features into an output. The objective function being model.predict()/model.transform() for any model we have built. Though computationally expensive, it can provide insight as to how, say, a Neural Network or SVM dubs which features to be the most influential in explaining the predictions.

    I wanted to ask the domain experts if this can be applied to UMAP and if it violates certain assumptions/theory that pertains to the calculation of UMAP embeddings. I've done some testing calculating Shapley Values using the SHAP package on a UMAP model I built. The data is 10 different types of metal concentrations, the class represents the quarry to which the sample came from. I can use Unsupervised UMAP with 1 component and can see class separation on samples from known quarries:

    Screen Shot 2022-11-17 at 11 16 45 AM

    And here is applying the UMAP model to my unknown samples (Class 0):

    Screen Shot 2022-11-17 at 11 19 19 AM

    If I create Shapley values for the model to explain my testing data (samples from unknown quarries), this can tell me notably which metal concentrations contributed the most in determining where the test data resided in the UMAP space. For instance, you'll note Sample 7 is in-between the K and SH group along Embedding 1:

    Screen Shot 2022-11-17 at 11 19 19 AM

    If I look at the Shapley values for Sample 7, I get this result:

    Screen Shot 2022-11-17 at 11 32 10 AM

    where the numbers in the plot pertain to the same units in the Embedding space. So what this plot tells me is that features Ti and K contributed the most towards Sample 7 deviating away from the average location in the 1 dimensional UMAP space. Is this a fair conclusion to make? If not, why? I appreciate you taking the time to look this through.

    Best, Sean Roginski Eigenvector Research INC.

    opened by rogo10 0
  • [FEATURE] `get_feature_names_out` for `UMAP`

    [FEATURE] `get_feature_names_out` for `UMAP`

    I propose to add a get_feature_names_out method to the UMAP object.

    get_feature_names_out is an important component for interpreting scikit-learn Pipeline objects. A get_feature_names_out call on a Pipeline only works if it is implemented for all components in the pipeline, except the last step (i.e. the Model).

    Scikit-learn recently implemented get_feature_names_out for all Transformers in their 1.1 release (Source).

    Example implementation:

    class UMAP(BaseEstimator):
        .
        .
        .
        def get_feature_names_out(self, feature_names_out=None):
            return ['umap_component_1', 'umap_component_2']
    
    opened by CarloLepelaars 2
  • AssertionError: Failed in nopython mode pipeline (step: native lowering)

    AssertionError: Failed in nopython mode pipeline (step: native lowering)

    when bio_embeddings config.yml i get AssertionError: Failed in nopython mode pipeline (step: native lowering) Storing i64 to ptr of i32 ('dim'). FE type int32

    opened by sudo349 0
Releases(0.5.3)
Owner
Leland McInnes
Leland McInnes
Runtime analysis of code with plotting

Runtime analysis of code with plotting A quick comparison among Python, Cython, and the C languages A Programming Assignment regarding the Programming

Cena Ashoori 2 Dec 24, 2021
A Python-based non-fungible token (NFT) generator built using Samilla and Matplotlib

PyNFT A Pythonic NF (non-fungible token) generator built using Samilla and Matplotlib Use python pynft.py [amount] The intention behind this generato

Ayush Gundawar 6 Feb 07, 2022
Simple and fast histogramming in Python accelerated with OpenMP.

pygram11 Simple and fast histogramming in Python accelerated with OpenMP with help from pybind11. pygram11 provides functions for very fast histogram

Doug Davis 28 Dec 14, 2022
Dipto Chakrabarty 7 Sep 06, 2022
Visualizations of linear algebra algorithms for people who want a deep understanding

Visualising algorithms on symmetric matrices Examples QR algorithm and LR algorithm Here, we have a GIF animation of an interactive visualisation of t

ogogmad 3 May 05, 2022
Jupyter Notebook extension leveraging pandas DataFrames by integrating DataTables and ChartJS.

Jupyter DataTables Jupyter Notebook extension to leverage pandas DataFrames by integrating DataTables JS. About Data scientists and in fact many devel

Marek Čermák 142 Dec 28, 2022
Visualize tensors in a plain Python REPL using Sparklines

Visualize tensors in a plain Python REPL using Sparklines

Shawn Presser 43 Sep 03, 2022
Visualize the bitcoin blockchain from your local node

Project Overview A new feature in Bitcoin Core 0.20 allows users to dump the state of the blockchain (the UTXO set) using the command dumptxoutset. I'

18 Sep 11, 2022
Visualize your pandas data with one-line code

PandasEcharts 简介 基于pandas和pyecharts的可视化工具 安装 pip 安装 $ pip install pandasecharts 源码安装 $ git clone https://github.com/gamersover/pandasecharts $ cd pand

陈华杰 2 Apr 13, 2022
Create charts with Python in a very similar way to creating charts using Chart.js

Create charts with Python in a very similar way to creating charts using Chart.js. The charts created are fully configurable, interactive and modular and are displayed directly in the output of the t

Nicolas H 68 Dec 08, 2022
termplotlib is a Python library for all your terminal plotting needs.

termplotlib termplotlib is a Python library for all your terminal plotting needs. It aims to work like matplotlib. Line plots For line plots, termplot

Nico Schlömer 553 Dec 30, 2022
This is my favourite function - the Rastrigin function.

This is my favourite function - the Rastrigin function. What sparked my curiosity and interest in the function was its complexity in terms of many local optimum points, which makes it particularly in

1 Dec 27, 2021
Create SVG drawings from vector geodata files (SHP, geojson, etc).

SVGIS Create SVG drawings from vector geodata files (SHP, geojson, etc). SVGIS is great for: creating small multiples, combining lots of datasets in a

Neil Freeman 78 Dec 09, 2022
Flexitext is a Python library that makes it easier to draw text with multiple styles in Matplotlib

Flexitext is a Python library that makes it easier to draw text with multiple styles in Matplotlib

Tomás Capretto 93 Dec 28, 2022
Simple plotting for Python. Python wrapper for D3xter - render charts in the browser with simple Python syntax.

PyDexter Simple plotting for Python. Python wrapper for D3xter - render charts in the browser with simple Python syntax. Setup $ pip install PyDexter

D3xter 31 Mar 06, 2021
A Python toolbox for gaining geometric insights into high-dimensional data

"To deal with hyper-planes in a 14 dimensional space, visualize a 3D space and say 'fourteen' very loudly. Everyone does it." - Geoff Hinton Overview

Contextual Dynamics Laboratory 1.8k Dec 29, 2022
A curated list of awesome Dash (plotly) resources

Awesome Dash A curated list of awesome Dash (plotly) resources Dash is a productive Python framework for building web applications. Written on top of

Luke Singham 1.7k Jan 07, 2023
A concise grammar of interactive graphics, built on Vega.

Vega-Lite Vega-Lite provides a higher-level grammar for visual analysis that generates complete Vega specifications. You can find more details, docume

Vega 4k Jan 08, 2023
This is a small program that prints a user friendly, visual representation, of your current bsp tree

bspcq, q for query A bspc analyzer (utility for bspwm) This is a small program that prints a user friendly, visual representation, of your current bsp

nedia 9 Apr 24, 2022
It's an application to calculate I from v and r. It can also plot a graph between V vs I.

Ohm-s-Law-Visualizer It's an application to calculate I from v and r using Ohm's Law. It can also plot a graph between V vs I. Story I'm doing my Unde

Sihab Sahariar 1 Nov 20, 2021