A Python package for Bayesian forecasting with object-oriented design and probabilistic models under the hood.

Overview

Orbit banner


GitHub release (latest SemVer) PyPI Build Status Documentation Status PyPI - Python Version Downloads

Disclaimer

This project

  • is stable and being incubated for long-term support. It may contain new experimental code, for which APIs are subject to change.
  • requires PyStan as a system dependency. PyStan is licensed under GPLv3, which is a free, copyleft license for software.

Orbit: A Python Package for Bayesian Forecasting

Orbit is a Python package for Bayesian time series forecasting and inference. It provides a familiar and intuitive initialize-fit-predict interface for time series tasks, while utilizing probabilistic programing languages under the hood.

Currently, it supports concrete implementations for the following models:

  • Exponential Smoothing (ETS)
  • Damped Local Trend (DLT)
  • Local Global Trend (LGT)

It also supports the following sampling methods for model estimation:

  • Markov-Chain Monte Carlo (MCMC) as a full sampling method
  • Maximum a Posteriori (MAP) as a point estimate method
  • Variational Inference (VI) as a hybrid-sampling method on approximate distribution

Installation

Installing Stable Release

Install from PyPi:

$ pip install orbit-ml

Install from source:

$ git clone https://github.com/uber/orbit.git
$ cd orbit
$ pip install -r requirements.txt
$ pip install .

Installing from Dev Branch

$ pip install git+https://github.com/uber/[email protected]

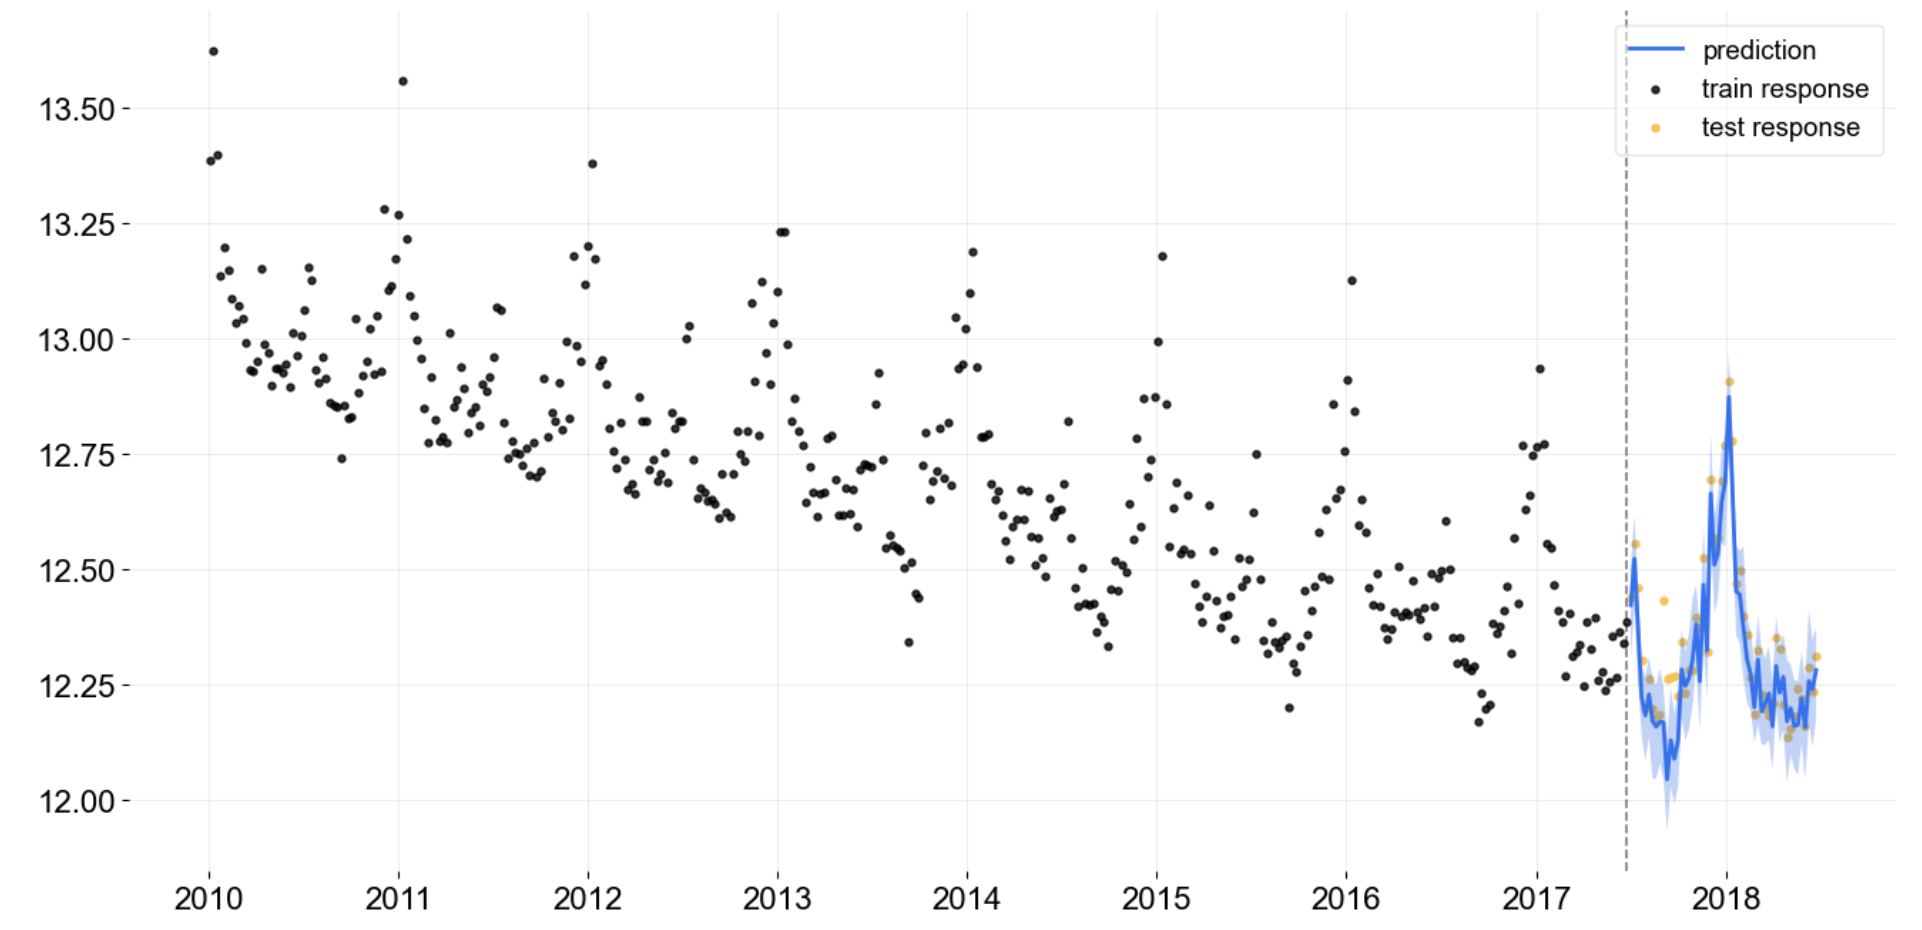
Quick Start with Damped-Local-Trend (DLT) Model

FULL Bayesian Prediction

from orbit.utils.dataset import load_iclaims
from orbit.models.dlt import DLTFull
from orbit.diagnostics.plot import plot_predicted_data

# log-transformed data
df = load_iclaims()
# train-test split
test_size=52
train_df=df[:-test_size]
test_df=df[-test_size:]

dlt = DLTFull(
    response_col='claims', date_col='week',
    regressor_col=['trend.unemploy', 'trend.filling', 'trend.job'],
    seasonality=52,
)
dlt.fit(df=train_df)

# outcomes data frame
predicted_df = dlt.predict(df=test_df)

plot_predicted_data(
    training_actual_df=train_df, predicted_df=predicted_df,
    date_col=dlt.date_col, actual_col=dlt.response_col,
    test_actual_df=test_df
)

full-pred

Contributing

We welcome community contributors to the project. Before you start, please read our code of conduct and check out contributing guidelines first.

Versioning

We document versions and changes in our changelog.

References

Documentation

Citation

To cite Orbit in publications, refer to the following whitepaper:

Orbit: Probabilistic Forecast with Exponential Smoothing

Bibtex:

@misc{
    ng2020orbit,
    title={Orbit: Probabilistic Forecast with Exponential Smoothing},
    author={Edwin Ng,
        Zhishi Wang,
        Huigang Chen,
        Steve Yang,
        Slawek Smyl},
    year={2020}, eprint={2004.08492}, archivePrefix={arXiv}, primaryClass={stat.CO}
}

Papers

  • Hyndman, R., Koehler, A. B., Ord, J. K., and Snyder, R. D. Forecasting with exponential smoothing: the state space approach. Springer Science & Business Media, 2008.
  • Bingham, E., Chen, J. P., Jankowiak, M., Obermeyer, F., Pradhan, N., Karaletsos, T., Singh, R., Szerlip, P., Horsfall, P., and Goodman, N. D. Pyro: Deep universal probabilistic programming. The Journal of Machine Learning Research, 20(1):973–978, 2019.
  • Taylor, S. J. and Letham, B. Forecasting at scale. The American Statistician, 72(1):37–45, 2018.
  • Hoffman, M.D. and Gelman, A. The No-U-Turn sampler: adaptively setting path lengths in Hamiltonian Monte Carlo. J. Mach. Learn. Res., 15(1), pp.1593-1623, 2014.

Related projects

Comments
  • Quick Start Example executes infinitely

    Quick Start Example executes infinitely

    Describe the bug Trying to launch example from https://uber.github.io/orbit/tutorials/quick_start.html The line dlt.fit(df=train_df) is executed infinitely (I've been waiting for hours and nothing happened)

    To Reproduce Steps to reproduce the behavior: Code:

    %matplotlib inline
    import orbit
    from orbit.utils.dataset import load_iclaims
    from orbit.models.dlt import ETSFull
    from orbit.diagnostics.plot import plot_predicted_data
    
    df = load_iclaims()
    date_col = 'week'
    response_col = 'claims'
    test_size = 52
    train_df = df[:-test_size]
    test_df = df[-test_size:]
    
    dlt = ETSFull(
        response_col=response_col,
        date_col=date_col,
        seasonality=52,
        seed=8888,
    )
    
    dlt.fit(df=train_df)


    Expected behavior As in the example, I expected the code to compile in few minutes.

    Environment (please complete the following information):

    • OS: macOS Big Sur 11.4
    • Python Version: 3.8.5
    • Versions of Major Dependencies pandas==1.1.3, scikit-learn==0.23.1, cython==0.29.21 , orbit==1.0.15
    bug 
    opened by polinariabar 16
  • Integrating LGT/DLT into ETS Base

    Integrating LGT/DLT into ETS Base

    Description

    A significant refactor of ETS related models. To make models more extensible, we want to create a base named as ETS to build core logic such as smoothing parameters and attributes, regression etc.

    Fixes # (issue)

    Type of change

    • [x] fully build ETS
    • [x] unit test
    • [x] doc update
    • [x] refactor LGT
    • [x] refactor DLT

    How Has This Been Tested?

    • [x] unit tests on ETS
    • [x] unit tests different position of columns of regressor matrices
    • [x] compare predictions of LGT and DLT against master
    • [x] unit tests for LGT/DLT negative regressors test cases
    review needed refactor WIP 
    opened by edwinnglabs 10
  • Changing Default Values of plotting and prediction percentiles

    Changing Default Values of plotting and prediction percentiles

    Description

    Having prediction percentiles=None is quite annoying since I find more often the reason to have LGT/DTLFull is to get reliable inference. Each time if I want to create a new DLTFULL(after testing DLTMAP), i need to figure out the right arg.

    Fixes # (issue)

    Change prediction_percentiles=None = prediction_percentiles=[5,95] and some default plotting value changed to make it less input required if we always use default prediction outcomes.

    Please delete options that are not relevant.

    • [x] Change related tutorial/docs update for cosmetic purpose (should not trigger any error)
    • [x] restore prediction outcomes label by using input prediction percentiles directly
    • [x] set prediction percentiles default as [5, 95] internally

    How Has This Been Tested?

    Since it is plotting, no test is related for this.

    refactor WIP 
    opened by edwinnglabs 8
  • UnboundLocalError: local variable 'pool' referenced before assignment

    UnboundLocalError: local variable 'pool' referenced before assignment

    lgt = LGT( response_col="Sales", date_col="Date", estimator='stan-mcmc', seasonality=12, seed=8888 ) lgt.fit(df)

    When i using it in ipynb file i didn't get any error but when i am using in .py file i getting error as UnboundLocalError: local variable 'pool' referenced before assignment i try to change few things in _map_parallel function but it won't work can you help to achive mcmc

    bug 
    opened by muthumula19 7
  • No such file or directory: '/usr/local/lib/python3.7/dist-packages/orbit/plot_style.mplstyle'

    No such file or directory: '/usr/local/lib/python3.7/dist-packages/orbit/plot_style.mplstyle'

    Describe the bug I'm trying to use the example in the quickstart guide. When I try to plot I get the following error, No such file or directory: '/usr/local/lib/python3.7/dist-packages/orbit/plot_style.mplstyle'

    To Reproduce quickstart guide

    Expected behavior Plotted data image

    Screenshots image

    Environment (please complete the following information): Colab

    bug 
    opened by JeremyWhittaker 7
  • Update tutorials notebooks

    Update tutorials notebooks

    Description

    Please include a summary of the change and which issue is fixed.

    Fixes # 309

    1. Updated tutorials:
    • quick start for LGT and DLT
    • utilities for simulation data generation
    1. Add tox.int for linting
    2. Fix lint issues in code
    3. Add encoding type when compiling the stan file
    opened by ppstacy 7
  • More user friendly reminder of data gap

    More user friendly reminder of data gap

    Describe the bug Following error occures while fitting some KTR models: ValueError: matmul: Input operand 1 has a mismatch in its core dimension 0, with gufunc signature (n?,k),(k,m?)->(n?,m?) (size 3 is different from 4)

    Stacktrace:

        dlt_reg.fit(df=df, point_method='mean')
    File "/opt/conda/envs/lib/python3.7/site-packages/orbit/forecaster/svi.py", line 25, in fit
        super().fit(df)
    File "/opt/conda/envs/lib/python3.7/site-packages/orbit/forecaster/forecaster.py", line 128, in fit
        self._model.set_dynamic_attributes(df=df, training_meta=self.get_training_meta())
    File "/opt/conda/envs/lib/python3.7/site-packages/orbit/template/ktr.py", line 798, in set_dynamic_attributes
        self._set_levs_and_seas(df, training_meta)
    File "/opt/conda/envs/lib/python3.7/site-packages/orbit/template/ktr.py", line 768, in _set_levs_and_seas
        self._seasonality_fs_order)
    File "/opt/conda/envs/lib/python3.7/site-packages/orbit/template/ktr.py", line 682, in _generate_seas
        seas_coef = np.squeeze(np.matmul(coef_knot, coef_kernel.transpose(1, 0)), axis=0).transpose(1, 0)
    

    Environment (please complete the following information):

    • OS: Ubuntu
    • Python Version: 3.7
    • orbit-ml==1.1.0dev
    bug 
    opened by iharshulhan 6
  • added a few eda plotting functions

    added a few eda plotting functions

    eda 5 plotting functions

    Description

    Please include a summary of the change and which issue is fixed.

    1. time series heat map
    2. correlcation heatmap
    3. Year over year outcome vs event
    4. Dual axis time series ploot
    5. a wrap grid chart for quick glance of selected features

    Fixes # (issue)

    Type of change

    Please delete options that are not relevant.

    • [ ] New feature

    How Has This Been Tested?

    Please explain how this patch was tested. E.g. unit tests, integration tests, manual tests. manual tests

    new idea / feature request WIP 
    opened by Ariel77 6
  • Initialization failed

    Initialization failed

    Describe the bug When fitting the ETSFull and ETSMap models on an hourly time frame, I'm receiving the following error: Initialization failed. You can find the full error description below in the Additional context

    Expected behavior I want to forecasting the demand according to an hourly data frame ( or 30 mins time frame). This is not even starting by fitting.

    Screenshots If applicable, add screenshots to help explain your problem.

    Environment (please complete the following information):

    • OS: macOS
    • Python Version: Python 3.6. 9
    • Versions of Major Dependencies : pandas==1.1.5, scikit-learn==0.24.2, 'matplotlib==3.3.4'

    Additional context

    RemoteTraceback Traceback (most recent call last) RemoteTraceback: """ Traceback (most recent call last): File "/usr/lib/python3.7/multiprocessing/pool.py", line 121, in worker result = (True, func(*args, **kwds)) File "/usr/lib/python3.7/multiprocessing/pool.py", line 44, in mapstar return list(map(*args)) File "stanfit4anon_model_982090c5656030fa038b63e5c383dbff_326254919482697396.pyx", line 373, in stanfit4anon_model_982090c5656030fa038b63e5c383dbff_326254919482697396._call_sampler_star File "stanfit4anon_model_982090c5656030fa038b63e5c383dbff_326254919482697396.pyx", line 406, in stanfit4anon_model_982090c5656030fa038b63e5c383dbff_326254919482697396._call_sampler RuntimeError: Initialization failed. """

    The above exception was the direct cause of the following exception:

    RuntimeError Traceback (most recent call last) in () ----> 1 dlt.fit(train_df)

    7 frames /usr/lib/python3.7/multiprocessing/pool.py in mapstar() 42 43 def mapstar(args): ---> 44 return list(map(*args)) 45 46 def starmapstar(args):

    stanfit4anon_model_982090c5656030fa038b63e5c383dbff_326254919482697396.pyx in stanfit4anon_model_982090c5656030fa038b63e5c383dbff_326254919482697396._call_sampler_star()

    stanfit4anon_model_982090c5656030fa038b63e5c383dbff_326254919482697396.pyx in stanfit4anon_model_982090c5656030fa038b63e5c383dbff_326254919482697396._call_sampler()

    RuntimeError: Initialization failed.

    bug 
    opened by dat19-8 5
  • Minor: Plot Components Warning

    Minor: Plot Components Warning

    Describe the bug I saw a warning when I run components plot in dev branch.

    To Reproduce

    plot_predicted_components(predicted_df=predicted_df, date_col=date_col, 
                            plot_components=['trend', 'seasonality_7', 'seasonality_365.25'])
    

    cell no. 11 under examples/ktrlie.ipynb

    Screenshots Screen Shot 2021-05-23 at 11 54 36 AM

    Environment (please complete the following information):

    • Python Version: 3.7
    • Matplotlib Version: 3.3.4
    bug 
    opened by edwinnglabs 5
  • Simple Bayesian linear model

    Simple Bayesian linear model

    Description

    Implementation of simple Bayesian linear model. Currently in Stan only. (in Pyro in near future) The model is the most basic Bayesian linear regression with all default non-informative priors in regression coefficients and error.

    Fixes #423

    Type of change

    • [x] New feature
    • [ ] This change requires a documentation update

    How Has This Been Tested?

    A few unit tests are written, with respect to initialization, StanMCMC, StanMAP.

    review needed 
    opened by pochoi 5
  • Deprecate support of regression in LGT model

    Deprecate support of regression in LGT model

    In previous discussion, LGT model with regression sometime can generate divergence / invalid result due to positivity condition of levels required. We should consider deprecate regression in LGT.

    enhancement 
    opened by edwinnglabs 0
  • Dev 114 cmdstan

    Dev 114 cmdstan

    Description

    A working branch to propose first solution in using cmdstanpy instead of pystan

    Fixes #793

    Type of change

    • [x] Using CmdStanPy in Stan Estimator instead of PyStan
    • [x] Updating all documents to reflect outlook using the new API
    • [ ] Further enhancement can be done by suppressing CmdStanPy log
    • [x] Added Python 3.9 for testing and reduce trigger to just publish

    How Has This Been Tested?

    All the original unit tests should be sufficient since this is a change just on the API. One small change is to add loglk in the posterior keys in all types of estimators with Stan.

    documentation review needed backend enhancement 
    opened by edwinnglabs 0
  • Refactor Estimator Classes

    Refactor Estimator Classes

    Right now we have the model load method separate between estimators and they are not implemented as a class function. It looks more readable to do so instead of (current approach) using a independent functions outside.

    refactor enhancement 
    opened by edwinnglabs 0
  • cmdstanpy instead of pystan

    cmdstanpy instead of pystan

    Hi! Is there any plan to move from pystan to cmdstanpy? The installation is sometimes hard because of, for example https://discourse.mc-stan.org/t/error-installing-pystan-in-python-3-10-with-gcc-9-2-0/27895/7

    enhancement 
    opened by juanitorduz 4
  • Report the exact missing regressor columns

    Report the exact missing regressor columns

    Right now, error message only indicate a miss match but not telling the exact missing column(s). We can report the missing columns explicitly in the condition of a missing check failure.

    enhancement 
    opened by edwinnglabs 0
Releases(v1.1.3)
  • v1.1.3(Nov 30, 2022)

    Core changes:

    • add python 3.8 unit tests (https://github.com/uber/orbit/pull/752)
    • optimize interface to be compatible with arviz (https://github.com/uber/orbit/pull/755)
    • requirements update (https://github.com/uber/orbit/pull/763)
    • code clean up (https://github.com/uber/orbit/pull/765)
    • dlt global trend prior adjustment (https://github.com/uber/orbit/pull/786)

    Documentation:

    Tutorial enhancement:

    • tutorial refresh (https://github.com/uber/orbit/pull/795)

    Utilities:

    • uses tqdm in parameters tuning (https://github.com/uber/orbit/pull/762)
    • residuals plot (https://github.com/uber/orbit/pull/758)
    • simpler stan compile interface (https://github.com/uber/orbit/pull/769)
    Source code(tar.gz)
    Source code(zip)
  • v1.1.2(Apr 28, 2022)

    Core changes:

    • Add Conda installation option (#679)
    • Suppress the lengthy Stan logging message (#696)
    • WBIC for pyro SVI sampling and BIC for MAP optimization (#719, #710)
    • Backtest module to include confidence intervals (#724)
    • Allow configuration for compiled Stan model path (#713)
    • Box plot for regression coefficient comparison (#737)
    • Bounded logistic growth for DLT model (#712)
    • Enhance regression output reporting (#739)å

    Documentation:

    • Add blacking linting to Github action workflow (#708)
    • Tutorial enhancement

    Utilities:

    • Add a new method make_future_df to prepare data frame for forecasting (#695)
    Source code(tar.gz)
    Source code(zip)
  • v1.1.2alpha(Apr 7, 2022)

    Core changes:

    • Add Conda installation option (#679)
    • Suppress the lengthy Stan logging message (#696)
    • WBIC for pyro SVI sampling and BIC for MAP optimization (#719, #710)
    • Backtest module to include confidence intervals (#724)
    • Allow configuration for compiled Stan model path (#713)
    • Box plot for regression coefficient comparison (#737)
    • Bounded logistic growth for DLT model (#712)
    • Enhance regression output reporting (#739)

    Documentation:

    • Add blacking linting to Github action workflow (#708)
    • Tutorial enhancement

    Utilities:

    • Add a new method make_future_df to prepare data frame for forecasting (#695)
    Source code(tar.gz)
    Source code(zip)
  • v1.1.1(Mar 4, 2022)

  • v1.1.0(Jan 12, 2022)

    Core changes

    • Redesign the model class structure with three core components: model template, estimator, and forecaster (#506, #507, #508, #513)
    • Introduce the Kernel-based Time-varying Regression (KTR) model (#515)
    • Implement the negative coefficient for LGT and KTR (#600, #601, #609)
    • Allow to handle missing values in response for LGT and DLT (#645)
    • Implement WBIC value for model candidate selection (#654)

    Documentation

    • A new series of tutorials for KTR (#558, #559)
    • Migrate the CI from TravisCI to Github Actions (#556)
    • Missing value handle tutorial (#645)
    • WBIC tutorial (#663)

    Utilities

    • New Plotting Palette (#571, #589)
    • Redesign the diagnostic plotting (#581, #607)
    • Raise a warning when date index is not evenly distributed (#639)
    Source code(tar.gz)
    Source code(zip)
  • v1.0.17(Aug 30, 2021)

  • v1.0.16(Aug 27, 2021)

  • v1.0.15(Aug 2, 2021)

    • Core changes:

      • Prediction functionality refactoring (#430)
      • KTRLite model enhancement and interface cleanup (#440)
      • More flexible scheduling config in Backtester (#447)
      • Allow extraction of training related metrics (e.g. ELBO loss) in Pyro SVI (#443)
      • Add a flag to keep the posterior samples or not in aggregated model (#465)
      • Bug fix and code improvement (#428, #438, #459, #470)
    • Documentation:

      • Clean up and standardize example notebooks (#462)
      • Tutorial update and enhancement (#431, #474)
    • Utilities:

      • Diagnostic plot with Arviz (#433)
      • Refine plotting palette (#434, #473)
      • Create an orbit-featured plotting style (#434)
    Source code(tar.gz)
    Source code(zip)
  • v1.0.13(Apr 3, 2021)

    • Core changes

      • Implement a new model KTRLite (#380)
      • Refactoring of BaseTemplate (#382, #384)
      • Add MAPTemplate, FullBayesianTemplate, and AggregatedPosteriorTemplate (#394)
      • Remove dependency of scikit-learn (#379, #381)
    • Documentation:

      • Add changelogs, release process, and contribution guidance (#363, #369, #370, #372)
      • Setup documentation deployment via TravisCI (#291)
      • New tutorial of making your own model (#389)
      • Tutorial enhancement (#383, #388)
    • Utilities:

      • New EDA plot utilities (#403, #407, #408)
      • More options for exisiting plot utilities (#396)
    Source code(tar.gz)
    Source code(zip)
  • v1.0.12(Feb 19, 2021)

    • Documentation update (#354, #362)
    • Providing prediction intervals for point posteriors such as AggregatedPosterior and MAP (#357, #359)
    • Abstract classes created to refactor posteriors estimation as templates (#360)
    • Automating documentation and tutorials; migrating docs to readthedocs (#291)
    Source code(tar.gz)
    Source code(zip)
  • v1.0.11(Feb 19, 2021)

    • Core changes:

      • a simple ETS class is created (#280, #296)
      • DLT is replacing LGT as the model used in the quick start and general demos (#305)
      • DLT and LGT are refactored to inherit from ETS (#280)
      • DLT now supports regression with strictly positive/negative signs (#296)
      • deprecation on regression with LGT (#305)
      • dependency update; remove enum34 and update other dependencies versions (#301)
      • fixed pickle error (#342)
    • Documentation:

      • updated tutorials (#309, #329, #332 )
      • docstring cleanup with inherited classes (#350)
    • Utilities:

      • include the provide hyper-parameters tuning (#288 )
      • include dataloader with a few standard datasets (#352, #337, #277, #248)
      • plotting functions now returns the plot object (#327, #325, #287, #279)
    Source code(tar.gz)
    Source code(zip)
  • v1.0.10(Nov 15, 2020)

  • v1.0.9(Nov 15, 2020)

  • v1.0.7(Nov 15, 2020)

  • v1.0.6(Nov 14, 2020)

  • v1.0.1(Sep 10, 2020)

  • v1.0.0(Sep 9, 2020)

  • v0.6.1(May 12, 2020)

  • v0.5.0(Apr 11, 2020)

  • v0.4.0(Apr 11, 2020)

Owner
Uber Open Source
Open Source Software at Uber
Uber Open Source
Powerful, efficient particle trajectory analysis in scientific Python.

freud Overview The freud Python library provides a simple, flexible, powerful set of tools for analyzing trajectories obtained from molecular dynamics

Glotzer Group 195 Dec 20, 2022
Two phase pipeline + StreamlitTwo phase pipeline + Streamlit

Two phase pipeline + Streamlit This is an example project that demonstrates how to create a pipeline that consists of two phases of execution. In betw

Rick Lamers 1 Nov 17, 2021
Making the DAEN information accessible.

The purpose of this repository is to make the information on Australian COVID-19 adverse events accessible. The Therapeutics Goods Administration (TGA) keeps a database of adverse reactions to medica

10 May 10, 2022
INFO-H515 - Big Data Scalable Analytics

INFO-H515 - Big Data Scalable Analytics Jacopo De Stefani, Giovanni Buroni, Théo Verhelst and Gianluca Bontempi - Machine Learning Group Exercise clas

Yann-Aël Le Borgne 58 Dec 11, 2022
Improving your data science workflows with

Make Better Defaults Author: Kjell Wooding [email protected] This is the git re

Kjell Wooding 18 Dec 23, 2022
Flexible HDF5 saving/loading and other data science tools from the University of Chicago

deepdish Flexible HDF5 saving/loading and other data science tools from the University of Chicago. This repository also host a Deep Learning blog: htt

UChicago - Department of Computer Science 255 Dec 10, 2022
MEAD: A Large-scale Audio-visual Dataset for Emotional Talking-face Generation [ECCV2020]

MEAD: A Large-scale Audio-visual Dataset for Emotional Talking-face Generation [ECCV2020] by Kaisiyuan Wang, Qianyi Wu, Linsen Song, Zhuoqian Yang, Wa

112 Dec 28, 2022
A Python and R autograding solution

Otter-Grader Otter Grader is a light-weight, modular open-source autograder developed by the Data Science Education Program at UC Berkeley. It is desi

Infrastructure Team 93 Jan 03, 2023
CINECA molecular dynamics tutorial set

High Performance Molecular Dynamics Logging into CINECA's computer systems To logon to the M100 system use the following command from an SSH client ss

J. W. Dell 0 Mar 13, 2022
t-SNE and hierarchical clustering are popular methods of exploratory data analysis, particularly in biology.

tree-SNE t-SNE and hierarchical clustering are popular methods of exploratory data analysis, particularly in biology. Building on recent advances in s

Isaac Robinson 61 Nov 21, 2022
Tokyo 2020 Paralympics, Analytics

Tokyo 2020 Paralympics, Analytics Thanks for checking out my app! It was built entirely using matplotlib and Tokyo 2020 Paralympics data. This applica

Petro Ivaniuk 1 Nov 18, 2021
A Big Data ETL project in PySpark on the historical NYC Taxi Rides data

Processing NYC Taxi Data using PySpark ETL pipeline Description This is an project to extract, transform, and load large amount of data from NYC Taxi

Unnikrishnan 2 Dec 12, 2021
A set of tools to analyse the output from TraDIS analyses

QuaTradis (Quadram TraDis) A set of tools to analyse the output from TraDIS analyses Contents Introduction Installation Required dependencies Bioconda

Quadram Institute Bioscience 2 Feb 16, 2022
Automated Exploration Data Analysis on a financial dataset

Automated EDA on financial dataset Just a simple way to get automated Exploration Data Analysis from financial dataset (OHLCV) using Streamlit and ta.

Darío López Padial 28 Nov 27, 2022
Conduits - A Declarative Pipelining Tool For Pandas

Conduits - A Declarative Pipelining Tool For Pandas Traditional tools for declaring pipelines in Python suck. They are mostly imperative, and can some

Kale Miller 7 Nov 21, 2021
Intercepting proxy + analysis toolkit for Second Life compatible virtual worlds

Hippolyzer Hippolyzer is a revival of Linden Lab's PyOGP library targeting modern Python 3, with a focus on debugging issues in Second Life-compatible

Salad Dais 6 Sep 01, 2022
Elementary is an open-source data reliability framework for modern data teams. The first module of the framework is data lineage.

Data lineage made simple, reliable, and automated. Effortlessly track the flow of data, understand dependencies and analyze impact. Features Visualiza

898 Jan 09, 2023
PyTorch implementation for NCL (Neighborhood-enrighed Contrastive Learning)

NCL (Neighborhood-enrighed Contrastive Learning) This is the official PyTorch implementation for the paper: Zihan Lin*, Changxin Tian*, Yupeng Hou* Wa

RUCAIBox 73 Jan 03, 2023
A CLI tool to reduce the friction between data scientists by reducing git conflicts removing notebook metadata and gracefully resolving git conflicts.

databooks is a package for reducing the friction data scientists while using Jupyter notebooks, by reducing the number of git conflicts between different notebooks and assisting in the resolution of

dataroots 86 Dec 25, 2022
Udacity - Data Analyst Nanodegree - Project 4 - Wrangle and Analyze Data

WeRateDogs Twitter Data from 2015 to 2017 Udacity - Data Analyst Nanodegree - Project 4 - Wrangle and Analyze Data Table of Contents Introduction Proj

Keenan Cooper 1 Jan 12, 2022