Tweets your monthly GitHub Contributions as Wordle grid

Overview

wordle-github-contributions

Tweets your monthly GitHub Contributions as Wordle grid

kizie-1488349199779389443

with tweepy support

name: Wordle GitHub Contributions

on:
  schedule:
    # at 08:00 on day-of-month 1
    - cron: "0 8 1 * *"

jobs:
  tweet-contribution-chart:
    runs-on: ubuntu-latest
    steps:
      - uses: actions/[email protected]
      - uses: vchrombie/[email protected]
        env:
          GH_TOKEN: ${{ secrets.GITHUB_TOKEN }}
          TWITTER_CONSUMER_KEY: ${{ secrets.TWITTER_CONSUMER_KEY }}
          TWITTER_CONSUMER_SECRET: ${{ secrets.TWITTER_CONSUMER_SECRET }}
          TWITTER_ACCESS_TOKEN: ${{ secrets.TWITTER_ACCESS_TOKEN }}
          TWITTER_ACCESS_TOKEN_SECRET: ${{ secrets.TWITTER_ACCESS_TOKEN_SECRET }}
You might also like...
Python script for writing text on github contribution chart.

Github Contribution Drawer Python script for writing text on github contribution chart. Requirements Python 3.X Getting Started Create repository Put

Visualise top-rated GitHub repositories in a barchart by keyword

This python script was written for simple purpose -- to visualise top-rated GitHub repositories in a barchart by keyword. Script generates html-page with barchart and information about repository owner, description, create date and update date.

OpenStats is a library built on top of streamlit that extracts data from the Github API and shows the main KPIs

Open Stats Discover and share the KPIs of your OpenSource project. OpenStats is a library built on top of streamlit that extracts data from the Github

Automatically generate GitHub activity!

Commit Bot Automatically generate GitHub activity! We've all wanted to be the developer that commits every day, but that requires a lot of work. Let's

Create Badges with stats of Scratch User, Project and Studio. Use those badges in Github readmes, etc.

Scratch-Stats-Badge Create customized Badges with stats of Scratch User, Studio or Project. Use those badges in Github readmes, etc. Examples Document

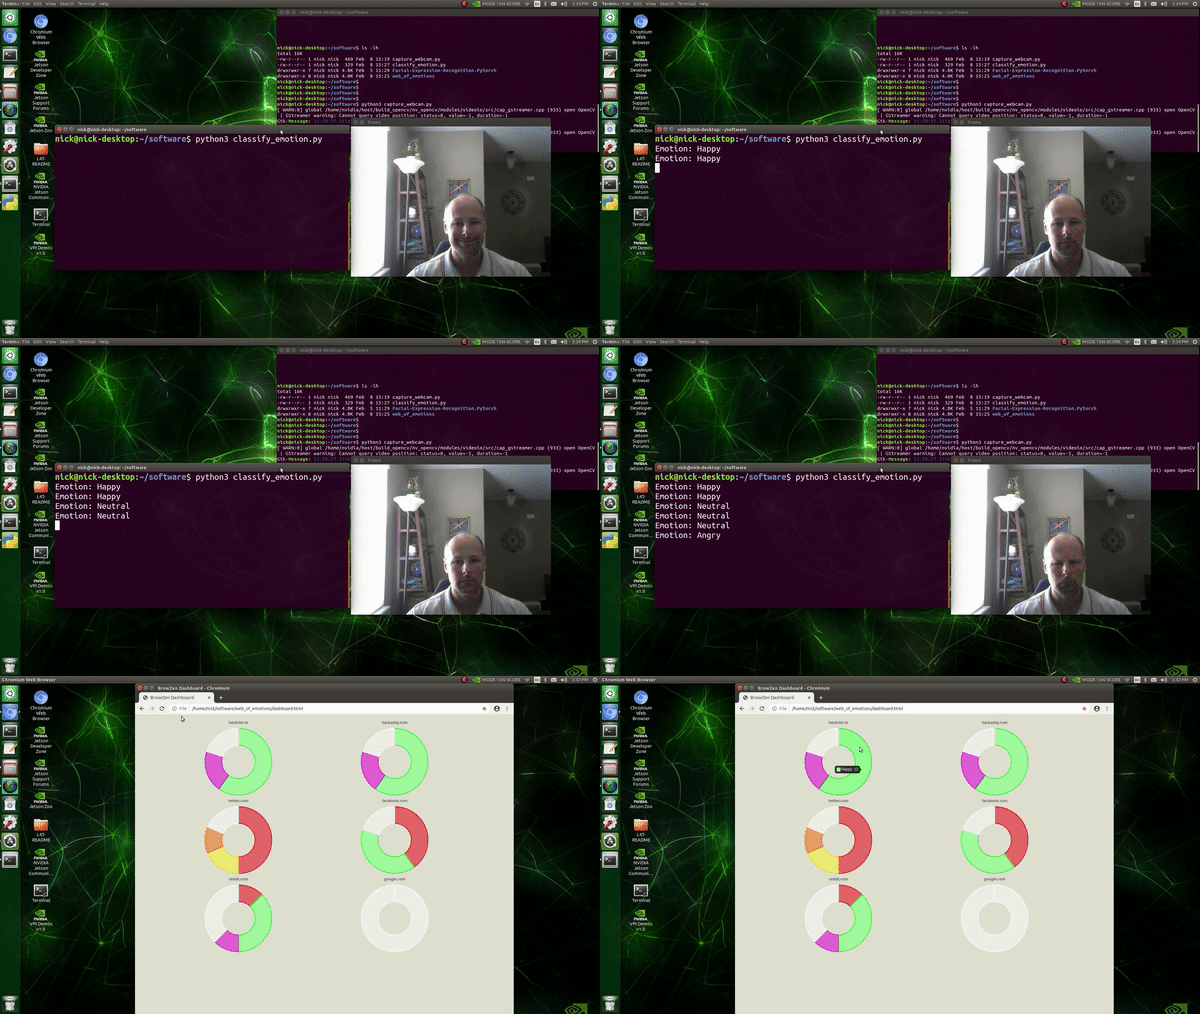
BrowZen correlates your emotional states with the web sites you visit to give you actionable insights about how you spend your time browsing the web.

BrowZen BrowZen correlates your emotional states with the web sites you visit to give you actionable insights about how you spend your time browsing t

An application that allows you to design and test your own stock trading algorithms in an attempt to beat the market.

StockBot is a Python application for designing and testing your own daily stock trading algorithms. Installation Use the

With Holoviews, your data visualizes itself.

HoloViews Stop plotting your data - annotate your data and let it visualize itself. HoloViews is an open-source Python library designed to make data a

With Holoviews, your data visualizes itself.

HoloViews Stop plotting your data - annotate your data and let it visualize itself. HoloViews is an open-source Python library designed to make data a

Releases(v0.2.0)
  • v0.2.0(Feb 15, 2022)

    New Features

    • f7650cb - Add support for adding custom hashtags to the tweet Now, you can add custom hashtags to your tweet. You need to define the hashtags in the workflow configuration file as a string.
            - uses: vchrombie/[email protected]
            with:
              HASHTAGS: 'wordle github contributions'
            env:
              GH_TOKEN: ${{ secrets.GITHUB_TOKEN }}
      

    Full Changelog: https://github.com/vchrombie/wordle-github-contributions/compare/v0.1.0...v0.2.0

    Source code(tar.gz)
    Source code(zip)
  • v0.1.0(Feb 14, 2022)

Owner
Venu Vardhan Reddy Tekula
Data Detective
Venu Vardhan Reddy Tekula
Apache Superset is a Data Visualization and Data Exploration Platform

Superset A modern, enterprise-ready business intelligence web application. Why Superset? | Supported Databases | Installation and Configuration | Rele

The Apache Software Foundation 50k Jan 06, 2023
Graphing communities on Twitch.tv in a visually intuitive way

VisualizingTwitchCommunities This project maps communities of streamers on Twitch.tv based on shared viewership. The data is collected from the Twitch

Kiran Gershenfeld 312 Jan 07, 2023
Plot, scatter plots and histograms in the terminal using braille dots

Plot, scatter plots and histograms in the terminal using braille dots, with (almost) no dependancies. Plot with color or make complex figures - similar to a very small sibling to matplotlib. Or use t

Tammo Ippen 207 Dec 30, 2022
Package managers visualization

Software Galaxies This repository combines visualizations of major software package managers. All visualizations are available here: http://anvaka.git

Andrei Kashcha 1.4k Dec 22, 2022
CompleX Group Interactions (XGI) provides an ecosystem for the analysis and representation of complex systems with group interactions.

XGI CompleX Group Interactions (XGI) is a Python package for the representation, manipulation, and study of the structure, dynamics, and functions of

Complex Group Interactions 67 Dec 28, 2022
Decision Border Visualizer for Classification Algorithms

dbv Decision Border Visualizer for Classification Algorithms Project description A python package for Machine Learning Engineers who want to visualize

Sven Eschlbeck 1 Nov 01, 2021
An animation engine for explanatory math videos

Powered By: An animation engine for explanatory math videos Hi there, I'm Zheer 👋 I'm a Software Engineer and student!! 🌱 I’m currently learning eve

Zaheer ud Din Faiz 2 Nov 04, 2021
demir.ai Dataset Operations

demir.ai Dataset Operations With this application, you can have the empty values (nan/null) deleted or filled before giving your dataset to machine le

Ahmet Furkan DEMIR 8 Nov 01, 2022
Lightweight data validation and adaptation Python library.

Valideer Lightweight data validation and adaptation library for Python. At a Glance: Supports both validation (check if a value is valid) and adaptati

Podio 258 Nov 22, 2022
With Holoviews, your data visualizes itself.

HoloViews Stop plotting your data - annotate your data and let it visualize itself. HoloViews is an open-source Python library designed to make data a

HoloViz 2.3k Jan 04, 2023
Python Data Validation for Humans™.

validators Python data validation for Humans. Python has all kinds of data validation tools, but every one of them seems to require defining a schema

Konsta Vesterinen 670 Jan 09, 2023
https://there.oughta.be/a/macro-keyboard

inkkeys Details and instructions can be found on https://there.oughta.be/a/macro-keyboard In contrast to most of my other projects, I decided to put t

Sebastian Staacks 209 Dec 21, 2022
A dashboard built using Plotly-Dash for interactive visualization of Dex-connected individuals across the country.

Dashboard For The DexConnect Platform of Dexterity Global Working prototype submission for internship at Dexterity Global Group. Dashboard for real ti

Yashasvi Misra 2 Jun 15, 2021
Schema validation just got Pythonic

Schema validation just got Pythonic schema is a library for validating Python data structures, such as those obtained from config-files, forms, extern

Vladimir Keleshev 2.7k Jan 06, 2023
CPG represent!

CoolPandasGroup CPG represent! Arianna Brandon Enne Luan Tracie Project requirements: use Pandas to clean and format datasets use Jupyter Notebook to

Enne 3 Feb 07, 2022
Matplotlib tutorial for beginner

matplotlib is probably the single most used Python package for 2D-graphics. It provides both a very quick way to visualize data from Python and publication-quality figures in many formats. We are goi

Nicolas P. Rougier 2.6k Dec 28, 2022
Generating interfaces(CLI, Qt GUI, Dash web app) from a Python function.

oneFace is a Python library for automatically generating multiple interfaces(CLI, GUI, WebGUI) from a callable Python object. oneFace is an easy way t

NaNg 31 Oct 21, 2022
A filler visualizer built using python

filler-visualizer 42 filler のログをビジュアライズしてスポーツさながら楽しむことができます! Usage (標準入力でvisualizer.pyに渡せばALL OK) 1. 既にあるログをビジュアライズする $ ./filler_vm -t 3 -p1 john_fill

Takumi Hara 1 Nov 04, 2021
A Jupyter - Leaflet.js bridge

ipyleaflet A Jupyter / Leaflet bridge enabling interactive maps in the Jupyter notebook. Usage Selecting a basemap for a leaflet map: Loading a geojso

Jupyter Widgets 1.3k Dec 27, 2022
simple tool to paint axis x and y

simple tool to paint axis x and y

G705 1 Oct 21, 2021