Personal IMDB Graphs with Bokeh

Overview

Personal IMDB Graphs with Bokeh

Do you like watching movies and also rate all of them in IMDB? Would you like to look at your IMDB stats based on your rated movie data? And also would like to see a bunch of graphs and tables. Come in then, this little script is for you!

Usage

Just start main.py. Also you could start manually (start separetly):

    bokeh serve --show main/ --port 5001
    bokeh serve all_movies/ circles/ directors/ heatmaps/ line_charts/ piecharts/ ratings_with_years/ ratings_with_genres/ stack/ tv_series/ --port 5002

Also, you could start separetly : bokeh serve --show line_charts/

Dependencies

  • Bokeh 2.4
  • Pandas
  • pybase64 (only for reading your .csv file in main/ folder)

Any error? New Ideas?

Please feel free to pull request, If you found any problem. Also you could contact me with [email protected]

Screenshots

All Movies Line Charts Directors Datatable Pie Chart Heatmap Heatmap Stack Circles

For more screenshots, look at Screenshots/ folder.

You might also like...
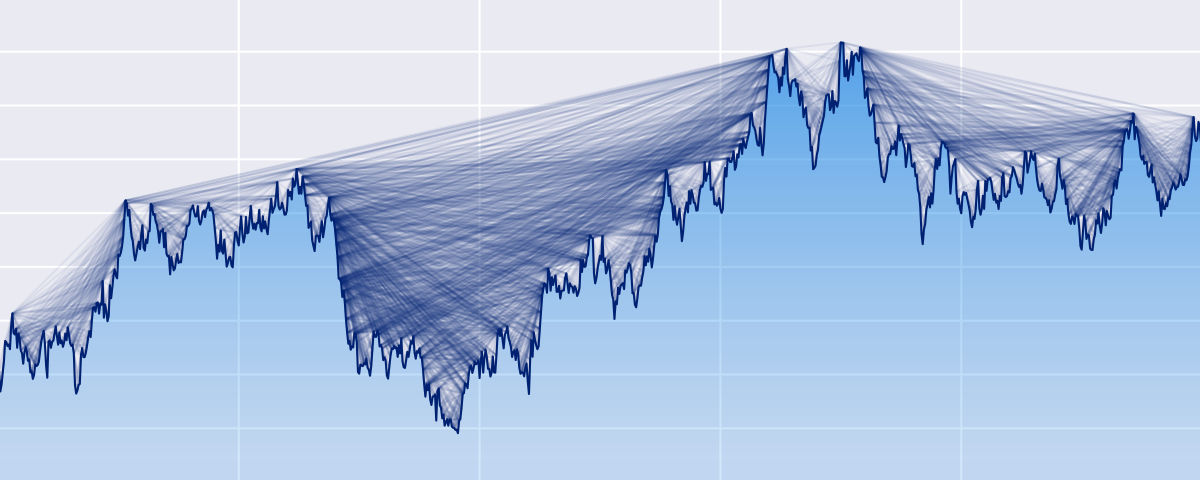
Python ts2vg package provides high-performance algorithm implementations to build visibility graphs from time series data.

ts2vg: Time series to visibility graphs The Python ts2vg package provides high-performance algorithm implementations to build visibility graphs from t

 Flame Graphs visualize profiled code
Flame Graphs visualize profiled code

Flame Graphs visualize profiled code

A simple interpreted language for creating basic mathematical graphs.

graphr Introduction graphr is a small language written to create basic mathematical graphs. It is an interpreted language written in python and essent

Mapomatic - Automatic mapping of compiled circuits to low-noise sub-graphs

mapomatic Automatic mapping of compiled circuits to low-noise sub-graphs Overvie

Kglab - an abstraction layer in Python for building knowledge graphs

Graph Data Science: an abstraction layer in Python for building knowledge graphs, integrated with popular graph libraries – atop Pandas, RDFlib, pySHACL, RAPIDS, NetworkX, iGraph, PyVis, pslpython, pyarrow, etc.

Fully Automated YouTube Channel ▶️with Added Extra Features.

Fully Automated Youtube Channel ▒█▀▀█ █▀▀█ ▀▀█▀▀ ▀▀█▀▀ █░░█ █▀▀▄ █▀▀ █▀▀█ ▒█▀▀▄ █░░█ ░░█░░ ░▒█░░ █░░█ █▀▀▄ █▀▀ █▄▄▀ ▒█▄▄█ ▀▀▀▀ ░░▀░░ ░▒█░░ ░▀▀▀ ▀▀▀░

Bokeh Plotting Backend for Pandas and GeoPandas

Pandas-Bokeh provides a Bokeh plotting backend for Pandas, GeoPandas and Pyspark DataFrames, similar to the already existing Visualization feature of

Bokeh Plotting Backend for Pandas and GeoPandas

Pandas-Bokeh provides a Bokeh plotting backend for Pandas, GeoPandas and Pyspark DataFrames, similar to the already existing Visualization feature of

A real-time financial data streaming pipeline and visualization platform using Apache Kafka, Cassandra, and Bokeh.

Realtime Financial Market Data Visualization and Analysis Introduction This repo shows my project about real-time stock data pipeline. All the code is

Personal Finance Forecaster - An AI tool for forecasting personal expenses

Personal Finance Forecaster - An AI tool for forecasting personal expenses

IMDbPY is a Python package useful to retrieve and manage the data of the IMDb movie database about movies, people, characters and companies

IMDbPY is a Python package for retrieving and managing the data of the IMDb movie database about movies, people and companies. Revamp notice Starting

IMDB film review sentiment classification based on BERT's supervised learning model.

IMDB film review sentiment classification based on BERT's supervised learning model. On the other hand, the model can be extended to other natural language multi-classification tasks.

IMDb + Auto + Unlimited Filter BoT

Telegram Movie Bot Features Auto Filter Manuel Filter IMDB Admin Commands Broadcast Index IMDB search Inline Search Random pics ids and User info Stat

Rottentomatoes, Goodreads and IMDB sites crawler. Semantic Web final project.

Crawler Rottentomatoes, Goodreads and IMDB sites crawler. Crawler written by beautifulsoup, selenium and lxml to gather books and films information an

IMDb + Auto + Unlimited Filter BoT

Telegram Movie Bot Features Auto Filter Manuel Filter IMDB Admin Commands Broadcast Index IMDB search Inline Search Random pics ids and User info Stat

Machine Learning Course Project, IMDB movie review sentiment analysis by lstm, cnn, and transformer

IMDB Sentiment Analysis This is the final project of Machine Learning Courses in Huazhong University of Science and Technology, School of Artificial I

Python IMDB Docker - A docker tutorial to containerize a python script.

Python_IMDB_Docker A docker tutorial to containerize a python script. Build the docker in the current directory: docker build -t python-imdb . Run the

Text classification on IMDB dataset using Keras and Bi-LSTM network

Text classification on IMDB dataset using Keras and Bi-LSTM Text classification on IMDB dataset using Keras and Bi-LSTM network. Usage python3 main.py

Notflix - Notion / Netflix and IMDb to organise your movie dates. Happy Valentine <3 from 0x1za
Notflix - Notion / Netflix and IMDb to organise your movie dates. Happy Valentine 3 from 0x1za

Welcome to notflix 👋 This is a project to help organise shows to watch with my

Releases(v1.0)
  • v1.0(Oct 6, 2021)

    Do you like watching movies and also rate all of them in IMDB? Would you like to look at your IMDB stats based on your rated movie data? And also would like to see a bunch of graphs and tables. Come in then, this little script is for you!

    Source code(tar.gz)
    Source code(zip)
Design your own matplotlib stylefile interactively

Tired of playing with font sizes and other matplotlib parameters every time you start a new project or write a new plotting function? Want all you plots have the same style? Use matplotlib configurat

yobi byte 207 Dec 08, 2022
A Python Library for Self Organizing Map (SOM)

SOMPY A Python Library for Self Organizing Map (SOM) As much as possible, the structure of SOM is similar to somtoolbox in Matlab. It has the followin

Vahid Moosavi 497 Dec 29, 2022
A simple, fast, extensible python library for data validation.

Validr A simple, fast, extensible python library for data validation. Simple and readable schema 10X faster than jsonschema, 40X faster than schematic

kk 209 Sep 19, 2022
A tool to plot and execute Rossmos's Formula, that helps to catch serial criminals using mathematics

Rossmo Plotter A tool to plot and execute Rossmos's Formula using python, that helps to catch serial criminals using mathematics Author: Amlan Saha Ku

Amlan Saha Kundu 3 Aug 29, 2022
An intuitive library to add plotting functionality to scikit-learn objects.

Welcome to Scikit-plot Single line functions for detailed visualizations The quickest and easiest way to go from analysis... ...to this. Scikit-plot i

Reiichiro Nakano 2.3k Dec 31, 2022
Lime: Explaining the predictions of any machine learning classifier

lime This project is about explaining what machine learning classifiers (or models) are doing. At the moment, we support explaining individual predict

Marco Tulio Correia Ribeiro 10.3k Dec 29, 2022
A python script to visualise explain plans as a graph using graphviz

README Needs to be improved Prerequisites Need to have graphiz installed on the machine. Refer to https://graphviz.readthedocs.io/en/stable/manual.htm

Edward Mallia 1 Sep 28, 2021
Mathematical learnings with Lean, for those of us who wish we knew more of both!

Lean for the Inept Mathematician This repository contains source files for a number of articles or posts aimed at explaining bite-sized mathematical c

Julian Berman 8 Feb 14, 2022
Tidy data structures, summaries, and visualisations for missing data

naniar naniar provides principled, tidy ways to summarise, visualise, and manipulate missing data with minimal deviations from the workflows in ggplot

Nicholas Tierney 611 Dec 22, 2022
The Python ensemble sampling toolkit for affine-invariant MCMC

emcee The Python ensemble sampling toolkit for affine-invariant MCMC emcee is a stable, well tested Python implementation of the affine-invariant ense

Dan Foreman-Mackey 1.3k Jan 04, 2023
Here I plotted data for the average test scores across schools and class sizes across school districts.

HW_02 Here I plotted data for the average test scores across schools and class sizes across school districts. Average Test Score by Race This graph re

7 Oct 27, 2021
IPython/Jupyter notebook module for Vega and Vega-Lite

IPython Vega IPython/Jupyter notebook module for Vega 5, and Vega-Lite 4. Notebooks with embedded visualizations can be viewed on GitHub and nbviewer.

Vega 335 Nov 29, 2022
Python package for the analysis and visualisation of finite-difference fields.

discretisedfield Marijan Beg1,2, Martin Lang2, Samuel Holt3, Ryan A. Pepper4, Hans Fangohr2,5,6 1 Department of Earth Science and Engineering, Imperia

ubermag 12 Dec 14, 2022
An open-source plotting library for statistical data.

Lets-Plot Lets-Plot is an open-source plotting library for statistical data. It is implemented using the Kotlin programming language. The design of Le

JetBrains 820 Jan 06, 2023
A Python wrapper of Neighbor Retrieval Visualizer (NeRV)

PyNeRV A Python wrapper of the dimensionality reduction algorithm Neighbor Retrieval Visualizer (NeRV) Compile Set up the paths in Makefile then make.

2 Aug 29, 2021
A Simple Flask-Plotly Example for NTU 110-1 DSSI Class

A Simple Flask-Plotly Example for NTU 110-1 DSSI Class Live Demo Prerequisites We will use Flask and Ploty to build a Flask application. If you haven'

Ting Ni Wu 1 Dec 11, 2021
This GitHub Repository contains Data Analysis projects that I have completed so far! While most of th project are focused on Data Analysis, some of them are also put here to show off other skills that I have learned.

Welcome to my Data Analysis projects page! This GitHub Repository contains Data Analysis projects that I have completed so far! While most of th proje

Kyle Dini 1 Jan 31, 2022
Farhad Davaripour, Ph.D. 1 Jan 05, 2022
Easily configurable, chart dashboards from any arbitrary API endpoint. JSON config only

Flask JSONDash Easily configurable, chart dashboards from any arbitrary API endpoint. JSON config only. Ready to go. This project is a flask blueprint

Chris Tabor 3.3k Dec 31, 2022
Interactive Dashboard for Visualizing OSM Data Change

Dashboard and intuitive data downloader for more interactive experience with interpreting osm change data.

1 Feb 20, 2022