Welcome to leafmap


![]()
![]()

A Python package for geospatial analysis and interactive mapping in a Jupyter environment.
- GitHub repo: https://github.com/giswqs/leafmap
- Documentation: https://leafmap.gishub.org
- PyPI: https://pypi.org/project/leafmap
- Conda-forge: https://anaconda.org/conda-forge/leafmap
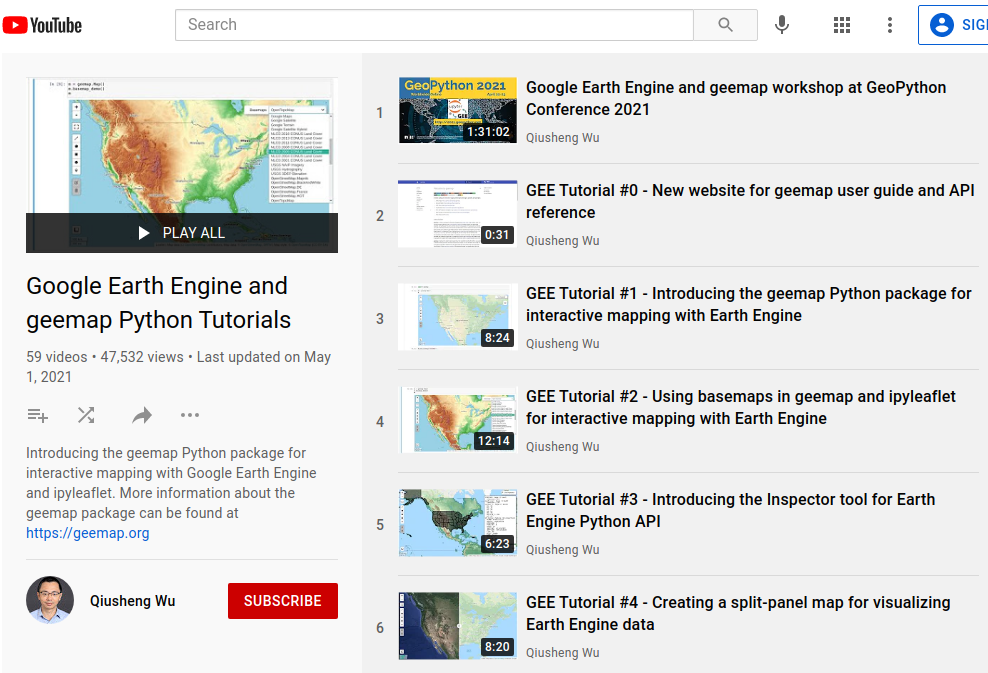
- Leafmap tutorials on YouTube: https://www.youtube.com/c/QiushengWu
- Free software: MIT license
Introduction
leafmap is a Python package for geospatial analysis and interactive mapping in a Jupyter environment. It is a spin-off project of the geemap Python package, which was designed specifically to work with Google Earth Engine (GEE). However, not everyone in the geospatial community has a GEE account. leafmap is designed to fill this gap for non-GEE users. It enables users to perform advanced geospatial analysis and interactive mapping with minimal coding in a Jupyter environment (e.g., Google Colab, JupyterLab, Jupyter notebook). It is built upon a number of open-source packages, such as folium and ipyleaflet (for creating interactive maps), WhiteboxTools and whiteboxgui (for analyzing geospatial data), and ipywidgets (for designing interactive graphical user interface).
The WhiteboxTools library currently contains 447 tools, which are each grouped based on their main function into one of the following categories. For a list of available tools with comprehensive documentation and usage details, please see the WhiteboxTools User Manual.
- Data Tools
- Geomorphometric Analysis
- GIS Analysis
- Hydrological Analysis
- Image Analysis
- LiDAR Analysis
- Mathematical and Statistical Analysis
- Stream Network Analysis
Launch the interactive notebook tutorial for the leafmap Python package with Google Colab or Binder now:
Key Features
Below is a partial list of features available for the leafmap package. Please check the examples page for notebook examples, GIF animations, and video tutorials.
- Create an interactive map with only one-line of code.
- Select from a variety of basemaps interactively without coding.
- Add XYZ and WMS tile services to the map.
- Convert CSV to points and display points as a marker cluster.
- Add local vector data (e.g., shapefile, GeoJSON, KML) to the map without coding.
- Add local raster data (e.g., GeoTIFF) to the map without coding.
- Add Cloud Optimized GeoTIFF (COG) and SpatialTemporal Asset Catalog (STAC) to the map.
- Add custom legends and colorbars to the map.
- Perform geospatial analysis using WhiteboxTools and whiteboxgui.
- Publish interactive maps with only one line of code.
Demo
YouTube Channel
I have created a YouTube Channel for sharing geospatial tutorials. You can subscribe to my channel for regular updates. If there is any specific tutorial you would like to see, please submit a feature request here.


 30 Oct 18, 2022
 1 Jan 25, 2022
 10.5k Jan 08, 2023
 531 Dec 28, 2022
 3 Nov 16, 2022
 230 Nov 10, 2022
 390 Dec 15, 2022
 11 Mar 02, 2022
 292 Dec 29, 2022
 159 Dec 23, 2022
 2 Feb 21, 2022
 104 Dec 30, 2022
 2 Nov 17, 2022
 747 Dec 19, 2022
 130 Dec 28, 2022
 1.2k Dec 26, 2022
 1 Jan 01, 2022
 342 Dec 31, 2022
 11 Nov 10, 2022