tokei-pie
Render tokei results to charts.
Installation
pip install tokei-pie
Usage
$ tokei -o json | tokei-pie

(This is how django looks like!)
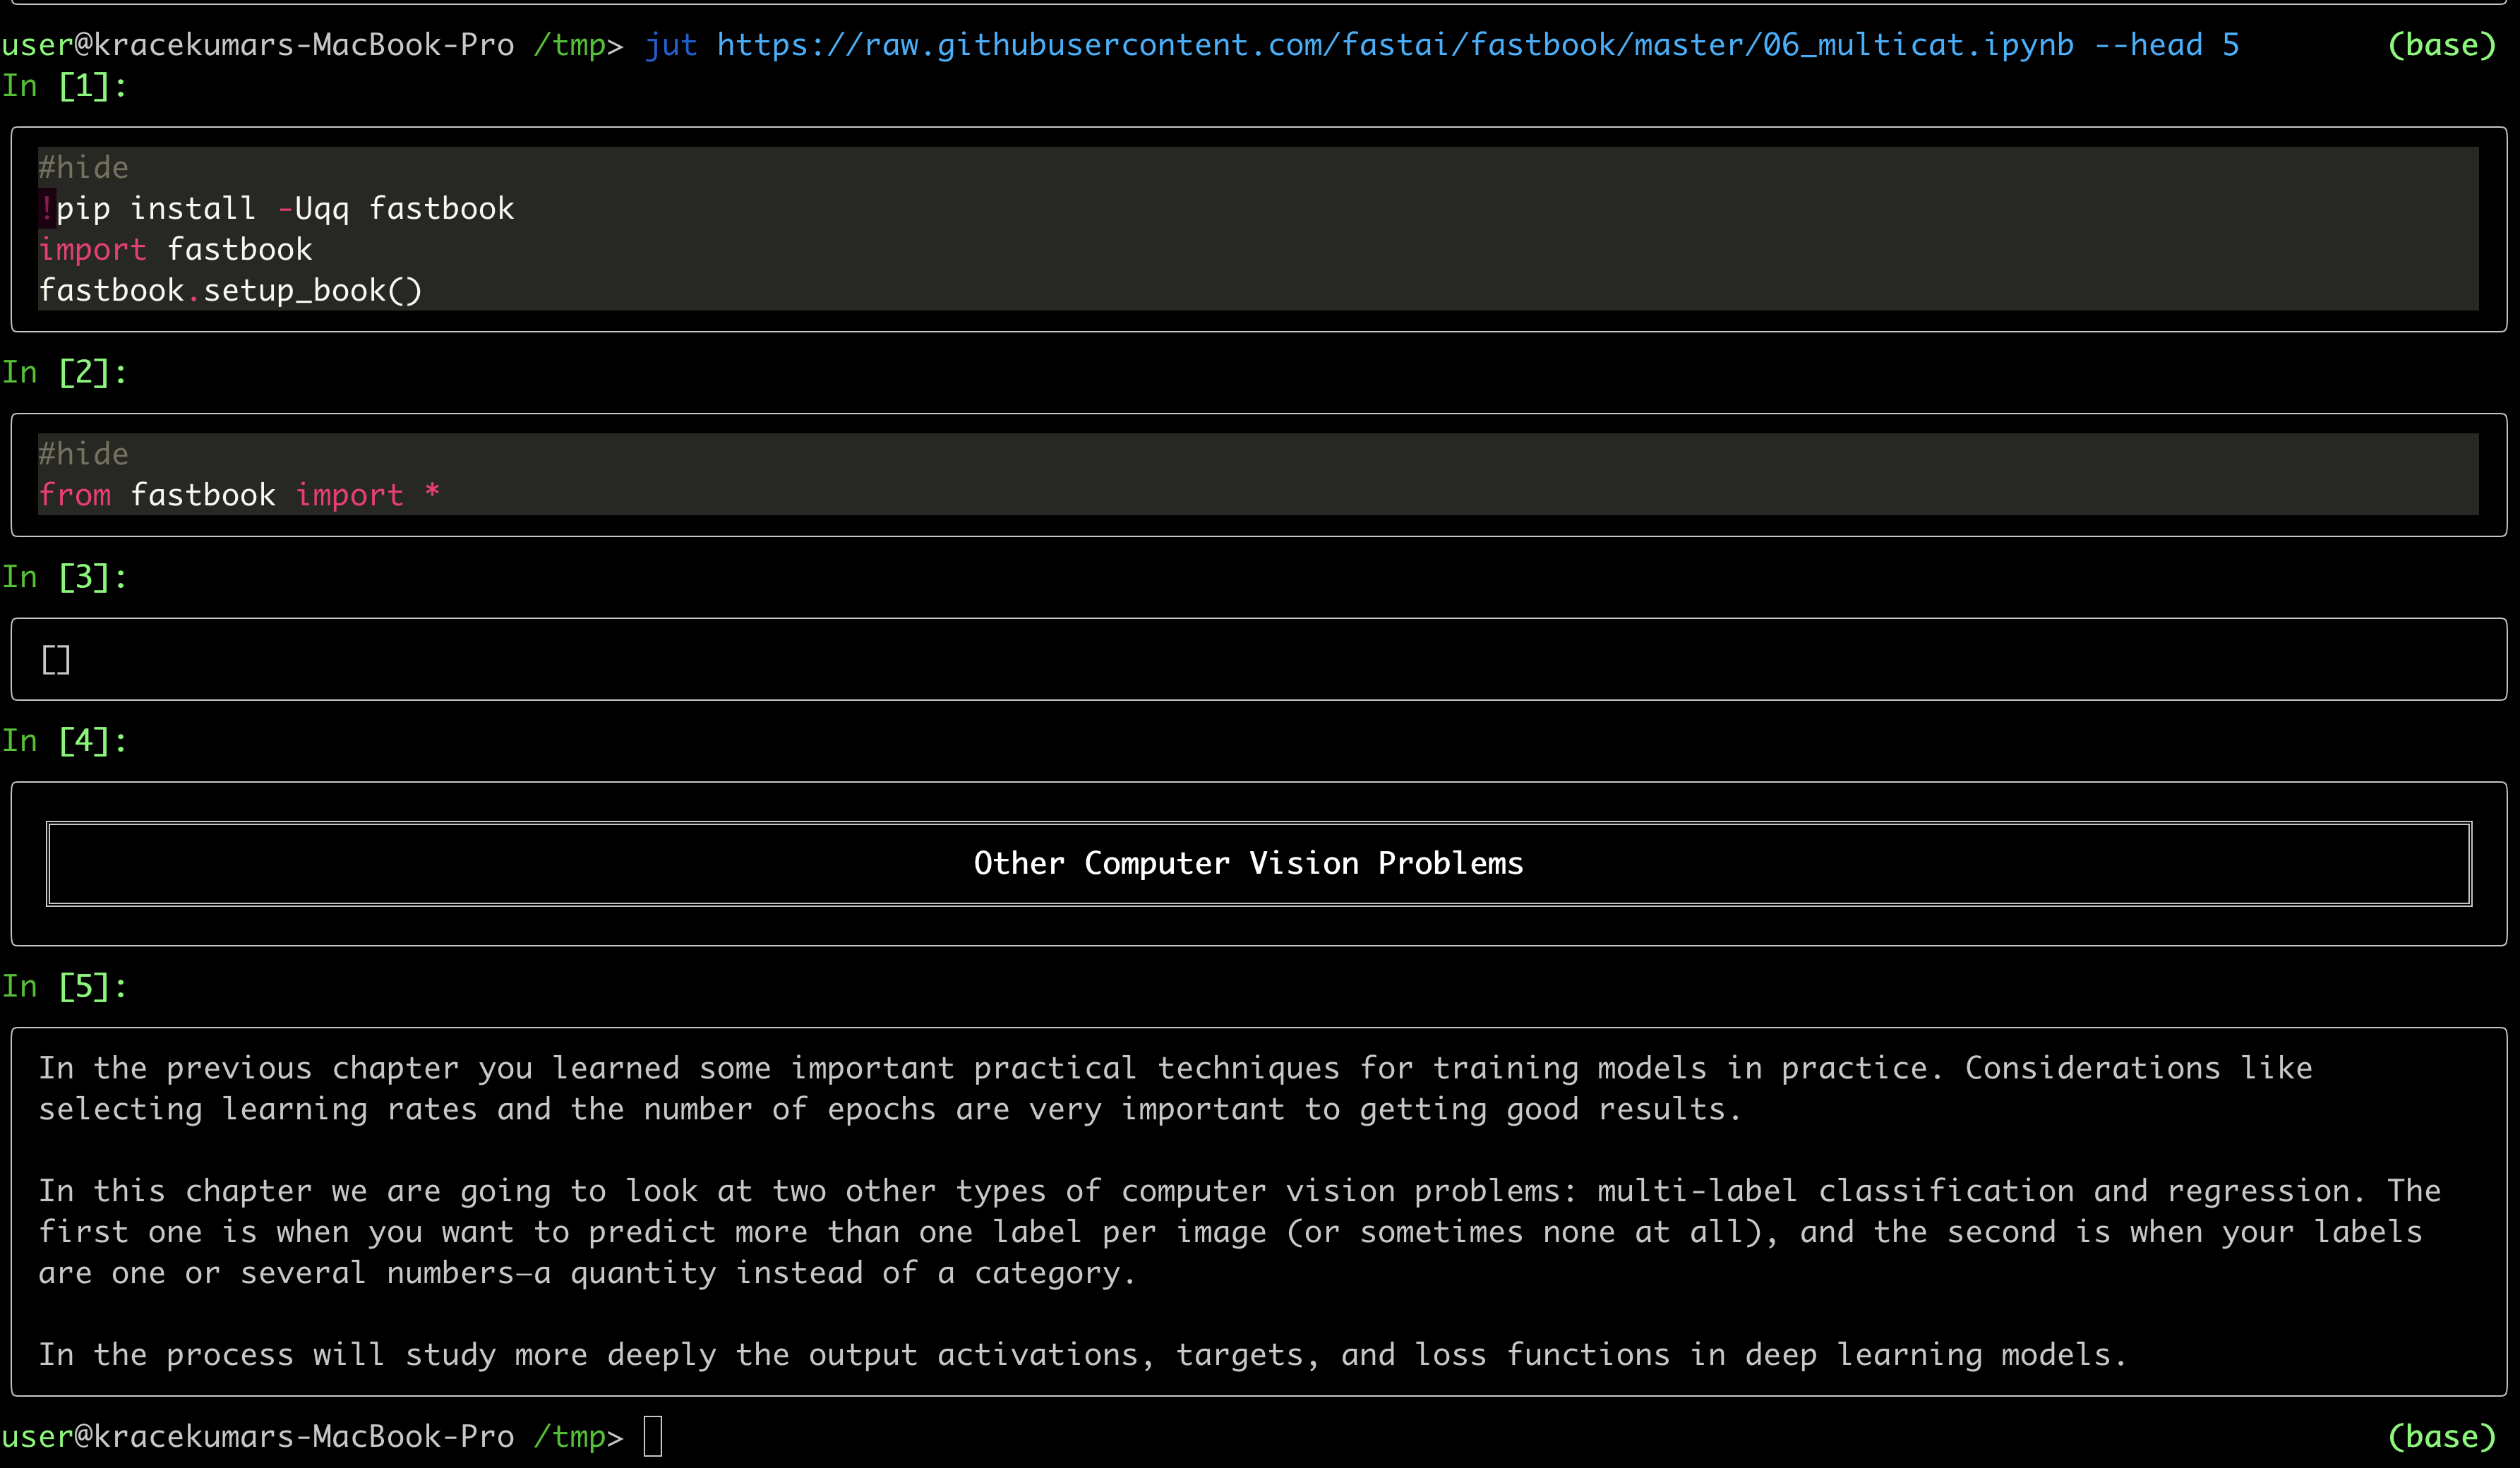
jut - JUpyter notebook Terminal viewer. The command line tool view the IPython/Jupyter notebook in the terminal. Install pip install jut Usage $jut --
ColorShell ─ 1.5 Planned for v2: setup.sh for setup alias This script converts HEX and RGB code to x1b x1b is code for colorize outputs, works on ou
Bokeh is an interactive visualization library for modern web browsers. It provides elegant, concise construction of versatile graphics, and affords hi
whiteboxgui An interactive GUI for WhiteboxTools in a Jupyter-based environment GitHub repo: https://github.com/giswqs/whiteboxgui Documentation: http
plotly.py Latest Release User forum PyPI Downloads License Data Science Workspaces Our recommended IDE for Plotly’s Python graphing library is Dash En
Bokeh is an interactive visualization library for modern web browsers. It provides elegant, concise construction of versatile graphics, and affords hi
nx_altair Draw NetworkX graphs with Altair nx_altair offers a similar draw API to NetworkX but returns Altair Charts instead. If you'd like to contrib
pdvega: Vega-Lite plotting for Pandas Dataframes pdvega is a library that allows you to quickly create interactive Vega-Lite plots from Pandas datafra
plotly.py Latest Release User forum PyPI Downloads License Data Science Workspaces Our recommended IDE for Plotly’s Python graphing library is Dash En
Currently when trying to run on any directory on Windows gives the following error.
Traceback (most recent call last):
  File "C:\Users\AppData\Local\Programs\Python\Python310\lib\runpy.py", line 196, in _run_module_as_main
    return _run_code(code, main_globals, None,
  File "C:\Users\AppData\Local\Programs\Python\Python310\lib\runpy.py", line 86, in _run_code
    exec(code, run_globals)
  File "C:\Users\AppData\Local\Programs\Python\Python310\Scripts\tokei-pie.exe\__main__.py", line 7, in <module>
  File "C:\Users\AppData\Local\Programs\Python\Python310\lib\site-packages\tokei_pie\main.py", line 227, in main
    sectors = read_root(data)
  File "C:\Users\AppData\Local\Programs\Python\Python310\lib\site-packages\tokei_pie\main.py", line 197, in read_root
    sectors.extend(read_reports(reports, key))
  File "C:\Users\erin.power\AppData\Local\Programs\Python\Python310\lib\site-packages\tokei_pie\main.py", line 176, in read_reports
    sectors = convert2sectors(tree, dict_reports, parent_id)
  File "C:\Users\AppData\Local\Programs\Python\Python310\lib\site-packages\tokei_pie\main.py", line 168, in convert2sectors
    dir2sector(".", dirs, reports, sectors, language)
  File "C:\Users\AppData\Local\Programs\Python\Python310\lib\site-packages\tokei_pie\main.py", line 112, in dir2sector
    subdirs = dirs[dirname]
KeyError: '.'
Reproduce:
$ tokei -o json /path/to/my_code | tokei-pie
Traceback (most recent call last):
  File "/Users/fming/wkspace/github/tokei-pie-plate/venv/bin/tokei-pie", line 8, in <module>
    sys.exit(main())
  File "/Users/fming/wkspace/github/tokei-pie-plate/venv/lib/python3.10/site-packages/tokei_pie/main.py", line 227, in main
    sectors = read_root(data)
  File "/Users/fming/wkspace/github/tokei-pie-plate/venv/lib/python3.10/site-packages/tokei_pie/main.py", line 197, in read_root
    sectors.extend(read_reports(reports, key))
  File "/Users/fming/wkspace/github/tokei-pie-plate/venv/lib/python3.10/site-packages/tokei_pie/main.py", line 176, in read_reports
    sectors = convert2sectors(tree, dict_reports, parent_id)
  File "/Users/fming/wkspace/github/tokei-pie-plate/venv/lib/python3.10/site-packages/tokei_pie/main.py", line 168, in convert2sectors
    dir2sector(".", dirs, reports, sectors, language)
  File "/Users/fming/wkspace/github/tokei-pie-plate/venv/lib/python3.10/site-packages/tokei_pie/main.py", line 140, in dir2sector
    _blanks, _code, _comments = dir2sector(
  File "/Users/fming/wkspace/github/tokei-pie-plate/venv/lib/python3.10/site-packages/tokei_pie/main.py", line 140, in dir2sector
    _blanks, _code, _comments = dir2sector(
  File "/Users/fming/wkspace/github/tokei-pie-plate/venv/lib/python3.10/site-packages/tokei_pie/main.py", line 140, in dir2sector
    _blanks, _code, _comments = dir2sector(
  [Previous line repeated 1 more time]
  File "/Users/fming/wkspace/github/tokei-pie-plate/venv/lib/python3.10/site-packages/tokei_pie/main.py", line 118, in dir2sector
    stats = reports[item]
KeyError: './lib/python3.10/site-packages/jinja2/compiler.py'
There seems to be something wrong with the relative path calculation.
When I pass folders as arguments to token I get a key error in tokei-pie
# in tokei repo
token src -o json | tokei-pie
Traceback (most recent call last):
  File "/opt/homebrew/bin/tokei-pie", line 8, in <module>
    sys.exit(main())
  File "/opt/homebrew/lib/python3.9/site-packages/tokei_pie/main.py", line 213, in main
    sectors = read_root(data)
  File "/opt/homebrew/lib/python3.9/site-packages/tokei_pie/main.py", line 194, in read_root
    sectors.extend(read_reports(reports, key))
  File "/opt/homebrew/lib/python3.9/site-packages/tokei_pie/main.py", line 173, in read_reports
    sectors = convert2sectors(tree, dict_reports, parent_id)
  File "/opt/homebrew/lib/python3.9/site-packages/tokei_pie/main.py", line 165, in convert2sectors
    dir2sector(".", dirs, reports, sectors, language)
  File "/opt/homebrew/lib/python3.9/site-packages/tokei_pie/main.py", line 115, in dir2sector
    stats = reports[item]
KeyError: './input.rs'
. by @laixintao in https://github.com/laixintao/tokei-pie/pull/4Full Changelog: https://github.com/laixintao/tokei-pie/compare/v1.1.2...v1.2.0
Source code(tar.gz)Profile and test to gain insights into the performance of your beautiful Python code View Demo - Report Bug - Request Feature QuickPotato in a nutshel
napari-script-editor A python script editor for napari based on PyQode. This napari plugin was generated with Cookiecutter using with @napari's cookie
naniar naniar provides principled, tidy ways to summarise, visualise, and manipulate missing data with minimal deviations from the workflows in ggplot
BoxPlotGraphAutomation Automatization of BoxPlot graph usin Python / Excel. This file is an automation of BoxPlot-Graph using python graph library mat
ipyleaflet A Jupyter / Leaflet bridge enabling interactive maps in the Jupyter notebook. Usage Selecting a basemap for a leaflet map: Loading a geojso
Ohm-s-Law-Visualizer It's an application to calculate I from v and r using Ohm's Law. It can also plot a graph between V vs I. Story I'm doing my Unde
A simple visual node editor for Python Ryven combines flow-based visual scripting with Python. It gives you absolute freedom for your nodes and a simp
Personal IMDB Graphs with Bokeh Do you like watching movies and also rate all of them in IMDB? Would you like to look at your IMDB stats based on your
Draw tree diagrams This repository contains two very different scripts to produce hierarchical tree diagrams like this one: $ ./classtree.py collectio
Pebble is a stat's visualization tool, this will provide a skeleton to develop a monitoring tool.
PyMeasure scientific package PyMeasure makes scientific measurements easy to set up and run. The package contains a repository of instrument classes a
pyecharts Python ❤️ ECharts = pyecharts English README 📣 简介 Apache ECharts (incubating) 是一个由百度开源的数据可视化,凭借着良好的交互性,精巧的图表设计,得到了众多开发者的认可。而 Python 是一门富有表达
animatplot A python package for making interactive as well as animated plots with matplotlib. Requires Python = 3.5 Matplotlib = 2.2 (because slider
HW 2: Visualizing interesting datasets Check out the project instructions here! Mean Earnings per Hour for Males and Females My first graph uses data
Le problème de Monty Hall C'est un jeu télévisé où il y a trois portes sur le plateau de jeu. Seule une de ces portes cache un trésor. Il n'y a rien d
Announcement Thank you to everyone who has used prettyplotlib and made it what it is today! Unfortunately, I no longer have the bandwidth to maintain
A community-maintained Python framework for creating mathematical animations.
Schematics Python Data Structures for Humans™. About Project documentation: https://schematics.readthedocs.io/en/latest/ Schematics is a Python librar
Matplotlib JOTA style for making figures This repo has Matplotlib JOTA style to format plots and figures for publications and presentation.
World Religion Data Visualization Visualization of the World Religion Data dataset by Correlates of War Project. Mostly personal project to famirializ
 169 Dec 27, 2022

 4 Oct 31, 2021
 17.1k Dec 31, 2022
 105 Dec 15, 2022

 12.7k Jan 5, 2023

 206 Dec 12, 2022

 342 Oct 26, 2022


 138 Dec 06, 2022
 9 Sep 20, 2022
 611 Dec 22, 2022
 1 Feb 07, 2022
 1.3k Dec 27, 2022
 1 Nov 20, 2021
 3.1k Jan 06, 2023
 2 Dec 15, 2021
 8 Dec 14, 2022
 2 Nov 17, 2021
 445 Jan 04, 2023
 13.1k Jan 03, 2023
 394 Dec 18, 2022
 7 Oct 27, 2021
 1 Jan 06, 2022
 1.6k Jan 06, 2023
 12.4k Dec 30, 2022
 2.5k Dec 28, 2022
 2 May 05, 2022
 1 Oct 15, 2022